


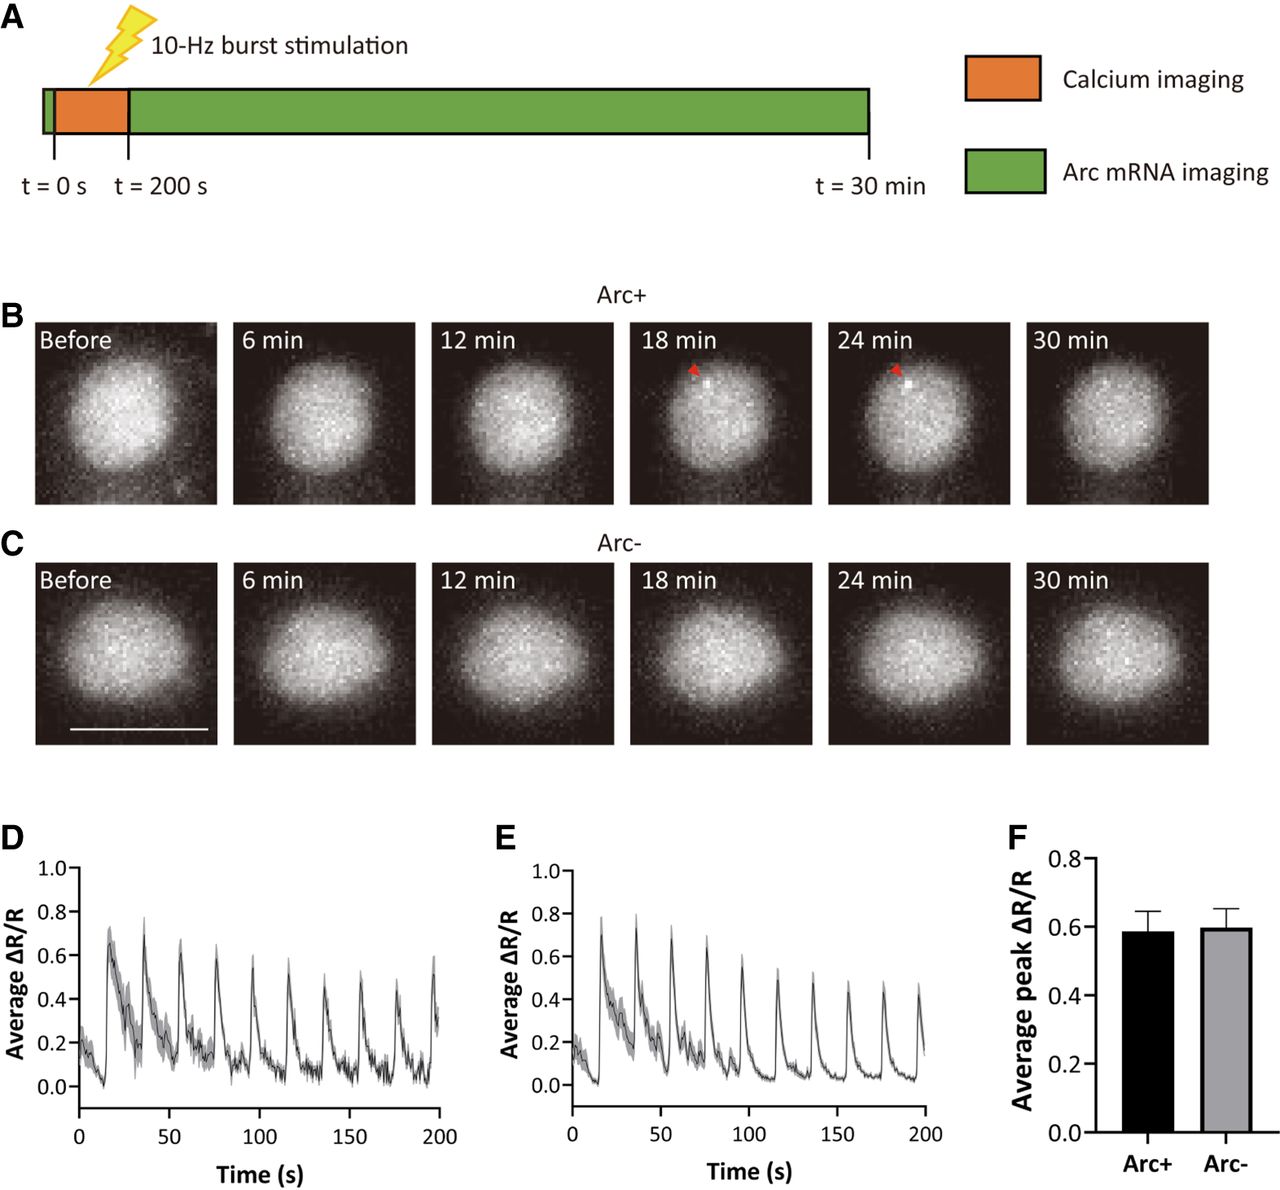
Figure 6.
Calcium activity in Arc+ and Arc− cells. (A) Experimental scheme to record calcium activity and Arc transcription. (B) Time-lapse images of an Arc+ cell. Red arrowheads indicate transcription sites of Arc mRNA. (C) Time-lapse images of an Arc− cell. (D) Average ΔR/R profile of Arc+ cells (n = 10 cells from three independent neuron cultures). (E) Average ΔR/R profile of Arc− cells (n = 17 cells from three independent neuron cultures). (F) Average peak ΔR/R values of the Arc+ and Arc− cells. Scale bars, 10 μm. Error bars indicate SEM.



