


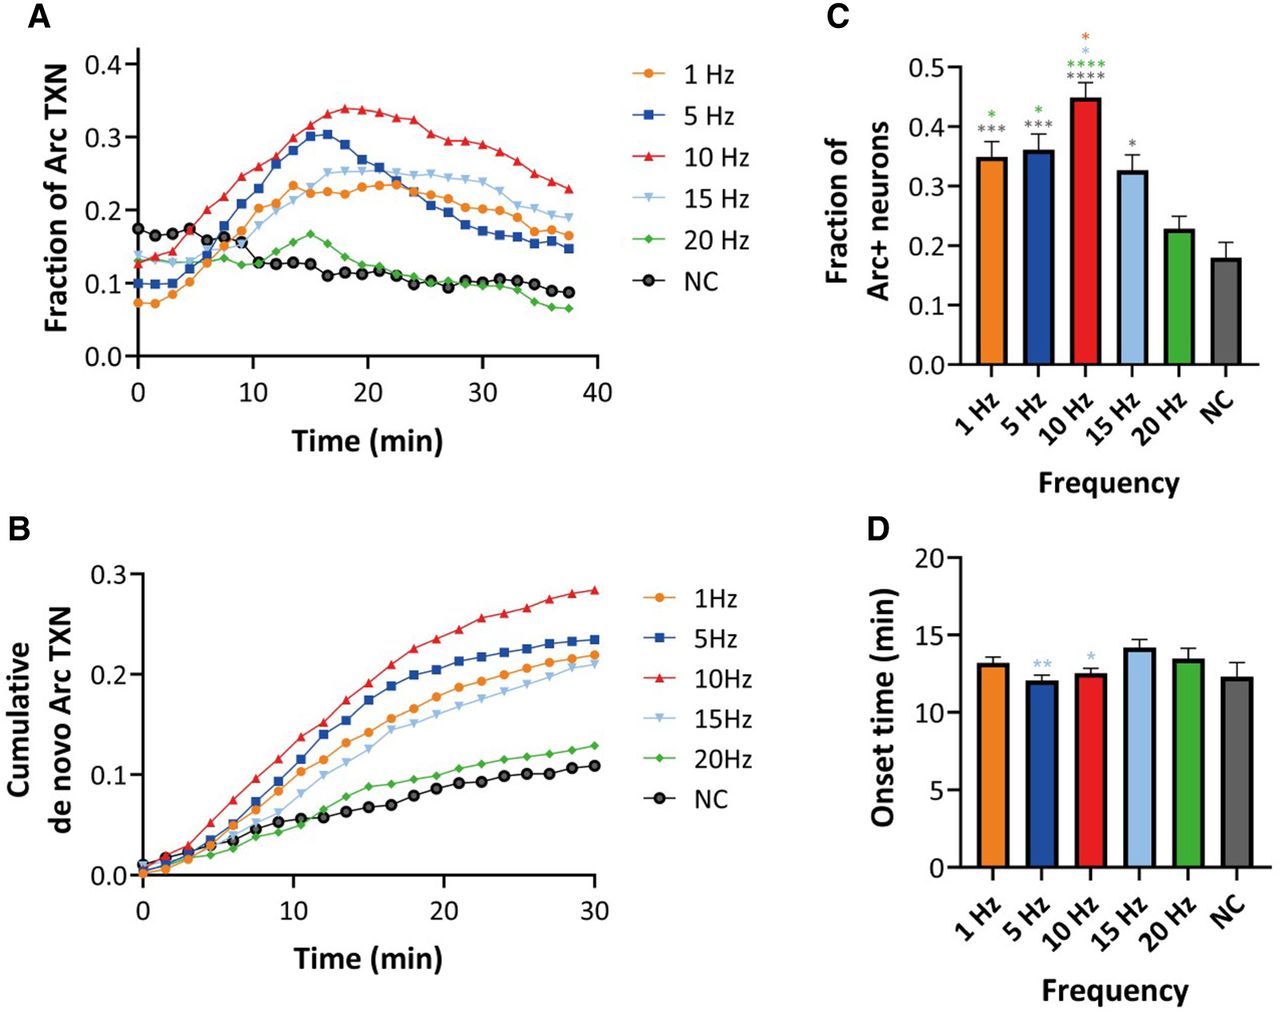
Transcription of Arc mRNA induced by the electrical burst stimulation with various burst frequencies. (A) Time course of Arc transcription. Each point represents the fraction of cells that were transcribing Arc mRNA at each time. (B) Cumulative fraction of de novo Arc transcription alleles. (C) Fraction of cells that transcribed Arc mRNA within 30 min after the onset of stimulation (n = 436–1096 cells, from three to six independent neural cultures, P < 0.0001 for one-way ANOVA test, (*) P < 0.05, (***) P < 0.001, (****) P < 0.0001, post hoc Tukey's t-tests). (D) Mean onset time of Arc transcription (n = 436–1096 cells, P = 0.0086 for one-way ANOVA test, (*) P < 0.05, (**) P < 0.01, post hoc Tukey's t-tests). Error bars indicate SEM.



