


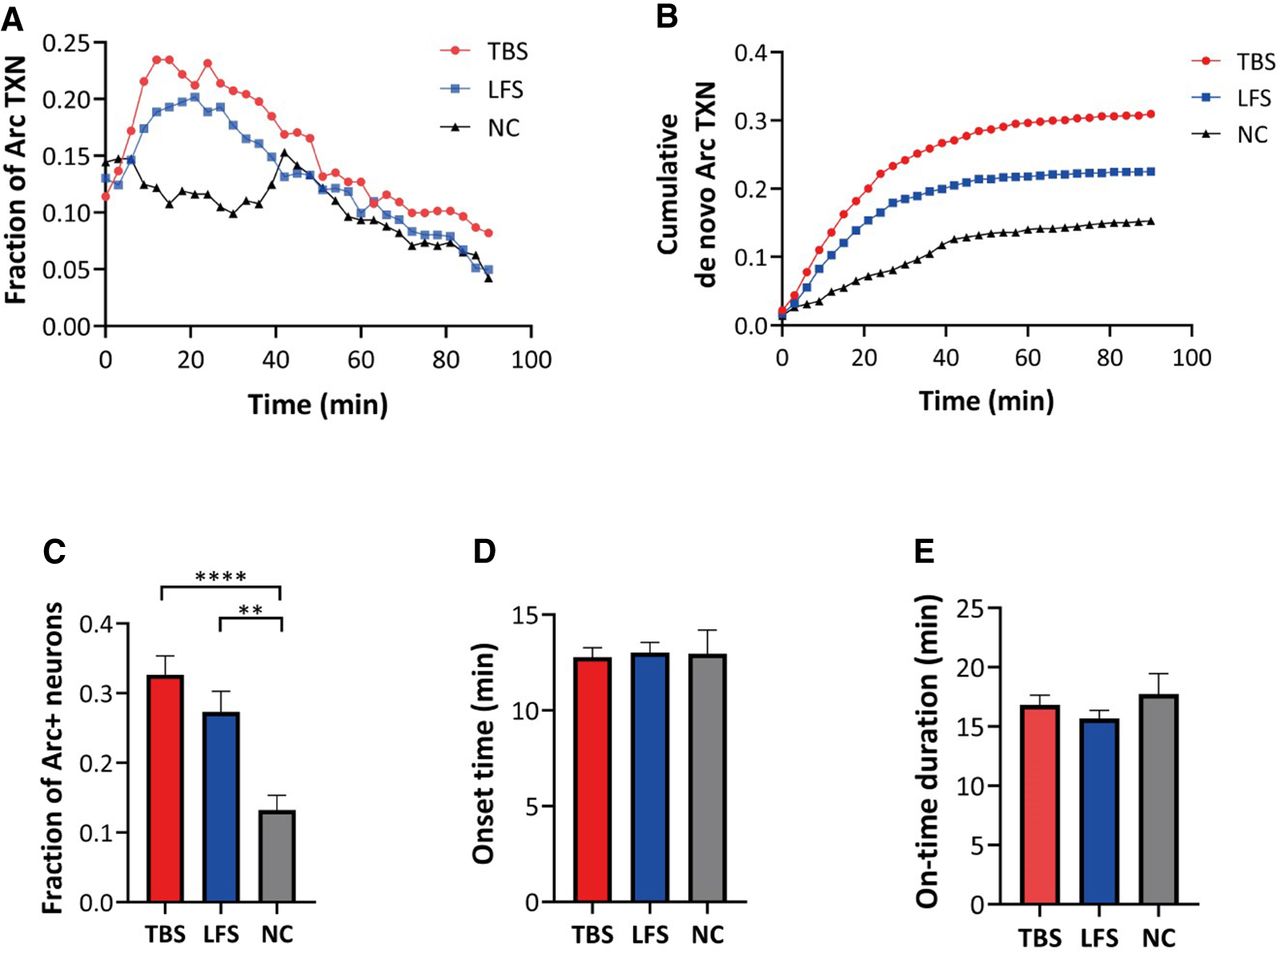
Transcription of Arc mRNA induced by TBS and LFS. (A) Time course of Arc transcription. Each point represents the fraction of cells that were transcribing Arc mRNA. (B) Time course of the cumulative fraction of de novo Arc transcription alleles. (C) Fraction of cells showing Arc transcription within 30 min of stimulation (n = 622 cells from four independent neuron cultures for TBS, n = 684 cells from four independent neuron cultures for LFS, n = 353 cells from three independent neuron cultures for NC, P < 0.0001 for one-way ANOVA test, (**) P < 0.01, (****) P < 0.0001, post hoc Tukey's t-tests). Imaging and stimulation started simultaneously at t = 0. TBS (10 stimulations of 5-Hz bursts) was given for 200 sec, and LFS (900 pulses at 1 Hz) was given for 900 sec. (D) Mean onset time of Arc transcription (n = 622 cells for TBS, n = 684 cells for LFS, n = 353 cells for NC. P = 0.9456 for one-way ANOVA test). (E) Mean on-time duration of Arc transcription (n = 622 cells for TBS, n = 684 cells for LFS, n = 353 cells for NC. P = 0.3855 for one-way ANOVA test). Error bars indicate standard error of mean (SEM).



