


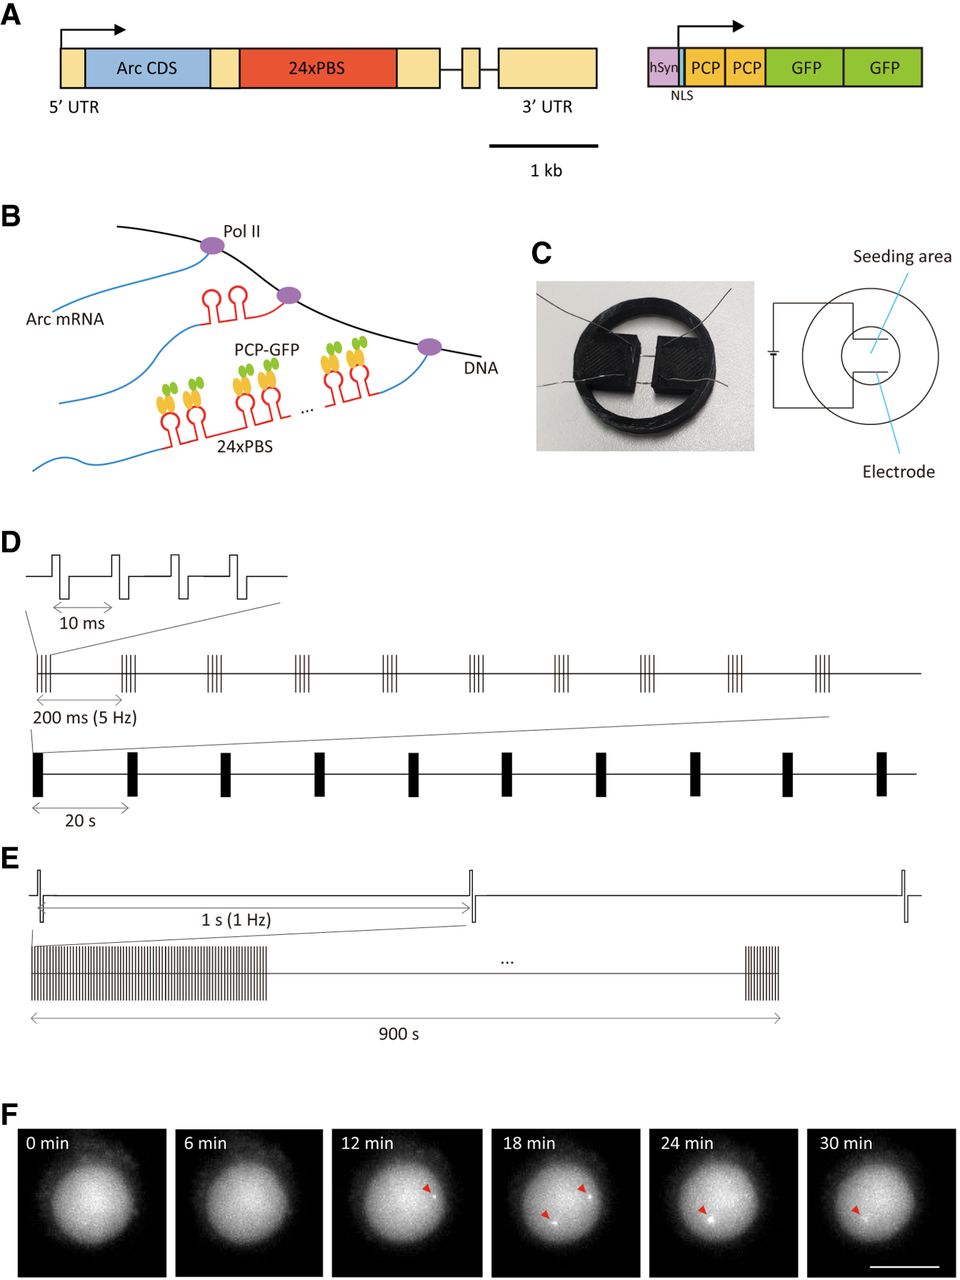
Arc-PBS tagging and electrical stimulation system for investigating Arc transcription in live neurons. (A) Schematic of the Arc-PBS gene with 24×PBS cassette inserted in the 3′-UTR region. Yellow boxes, UTR; black lines, introns; NLS, nuclear localization sequence. (B) Arc mRNAs labeled with 24×PBS repeats are transcribed from the template DNA, and PCP-GFP fusion proteins bind to the 24×PBS repeats. Pol II, RNA polymerase II. (C) Schematic of electrical stimulation system. (D) Schematic of TBS. Each burst consists of four biphasic pulses with 2 msec duration and 10 msec intervals (top). Each train consists of 10 bursts with 200 msec intervals (middle). TBS consists of 10 trains with 20 sec intervals (bottom). (E) Schematic of LFS. LFS consists of 900 pulses with 1 sec interval. (F) Time-lapse images of Arc transcription induced by TBS. Red arrowheads indicate transcription sites of Arc mRNA. Scale bar, 10 μm.



