


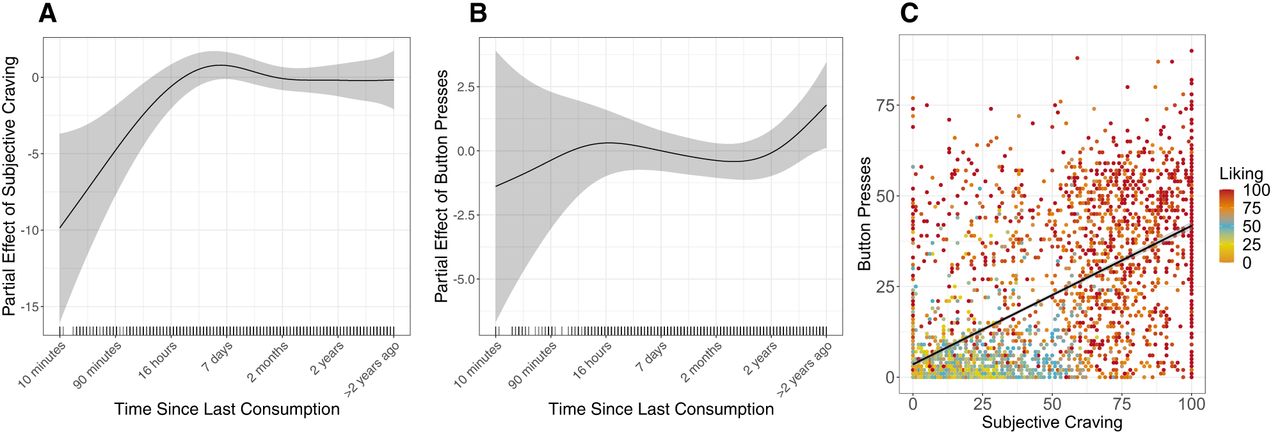
Results from study 2. For the GAM curves, y-axis values are the residual mean subjective craving/button presses where the covariates in each analysis are accounted for. 95% confidence intervals are shown in gray. (A) GAM curve for Subjective Craving by Time. Study 1 found a significant nonlinear relationship between time and subjective craving (F = 3.98, edf = 4.13, P = 0.001). (B) GAM curve for Instrumental Behavior by Time. Study 1 found a significant nonlinear relationship between time and instrumental behavior (F = 1.52, edf = 3.24, P = 0.19). (C) The relationship between button presses and self-report of craving. Study 2 found a significant relationship between button presses and self-report of craving (P < 0.001), replicating study 1.



