


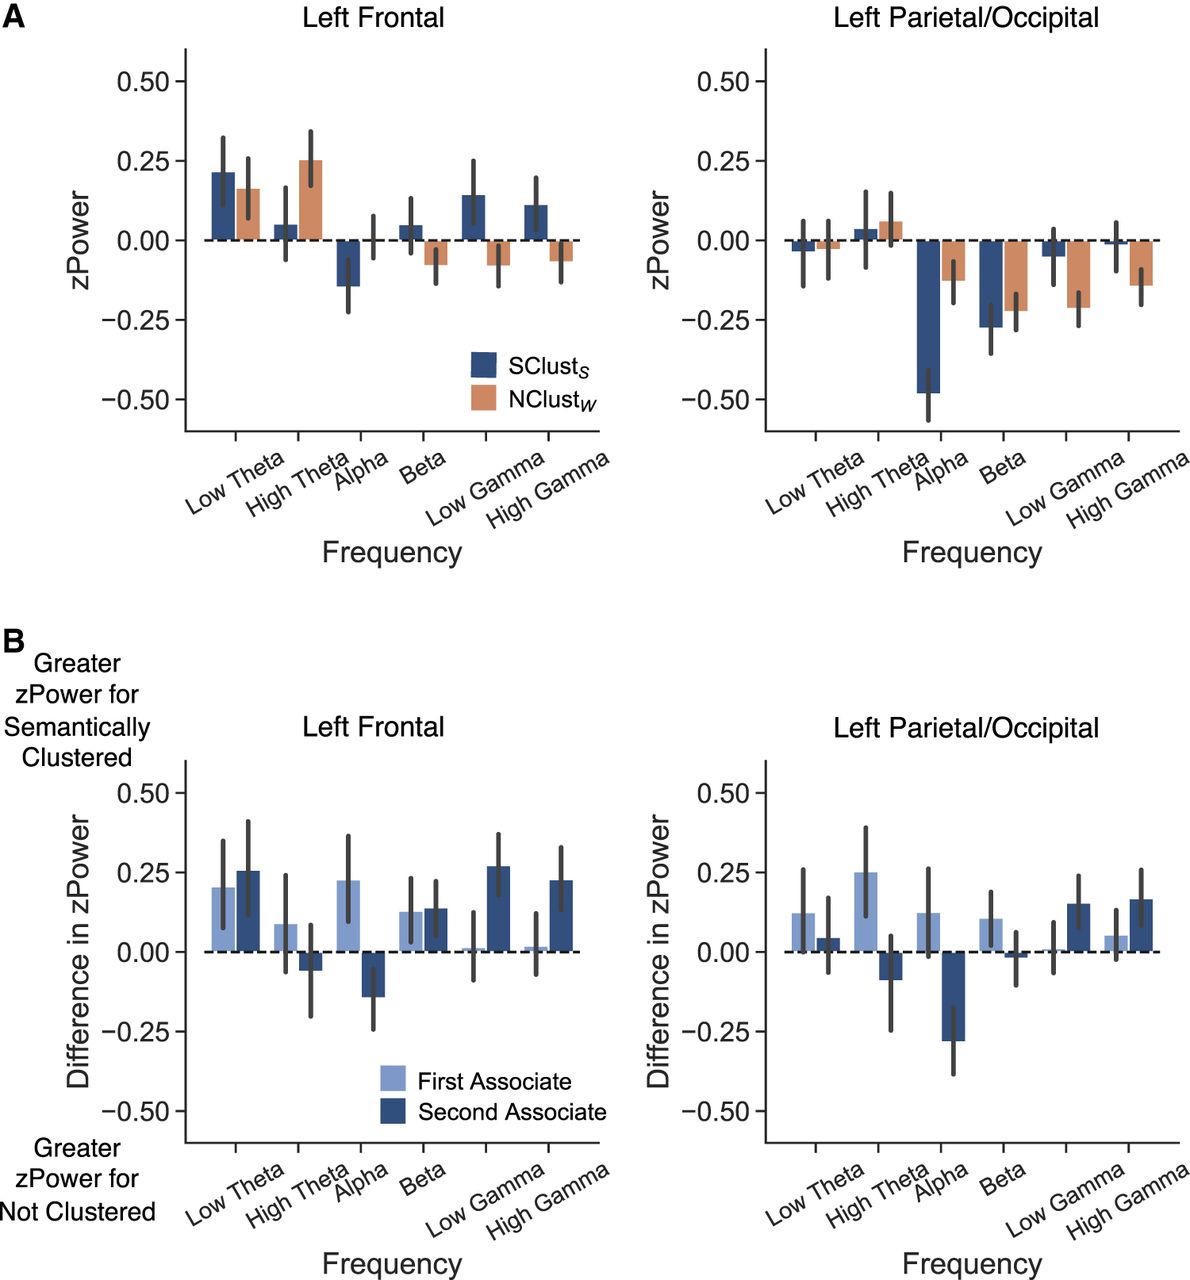
Differential univariate effects for semantically clustered second associates. zPower is shown for six frequency bands (low θ: 3–4 Hz, high θ: 6–8 Hz, α: 10–14 Hz, β: 16–26 Hz, low γ: 28–42 Hz, high γ: 44–100 Hz) across two ROIs, left frontal and left parietal/occipital. zPower is averaged across the stimulus interval (2000 ms). Error bars denote the standard error of the mean. (A) The top panel shows zPower for second associates that were strongly semantically associated and subsequently semantically clustered (blue, SClusts) and second associates that were weakly semantically associated and subsequently recalled but not clustered (orange, NClustw). (B) The bottom panel shows the difference in zPower between strong items that were subsequently semantically clustered and strong items that were subsequently recalled, but not clustered, for first (light blue) and second associates (dark blue). Positive values indicate greater zPower for items later semantically clustered, negative values indicate greater zPower for items later recalled, but not clustered.



