


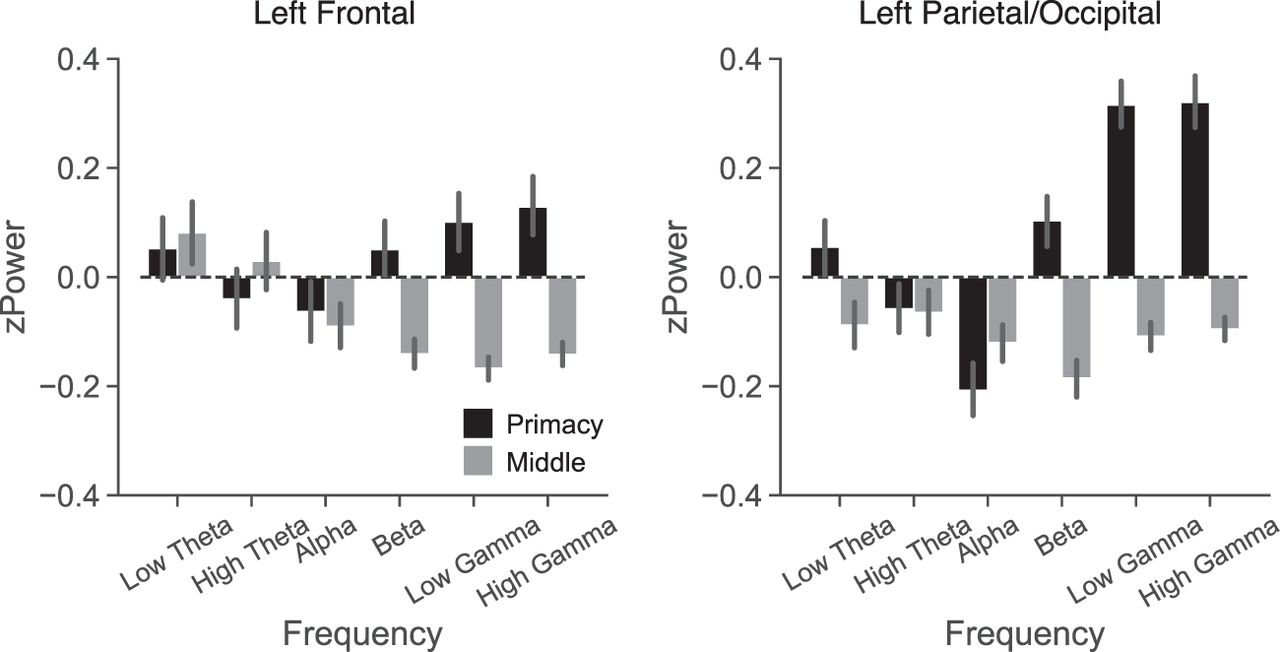
Figure 2.
Differential univariate effects for primacy and middle items. zPower is shown for six frequency bands (low θ: 3–4 Hz, high θ: 6–8 Hz, α: 10–14 Hz, β: 16–26 Hz, low γ: 28–42 Hz, high γ: 44–100 Hz) across two ROIs, left frontal and left parietal/occipital. zPower is averaged across the stimulus interval (2000 ms). zPower for primacy items (serial positions 1–4) are shown in black and middle items (serial positions 5–8) are shown in gray. Error bars denote standard error of the mean.



