


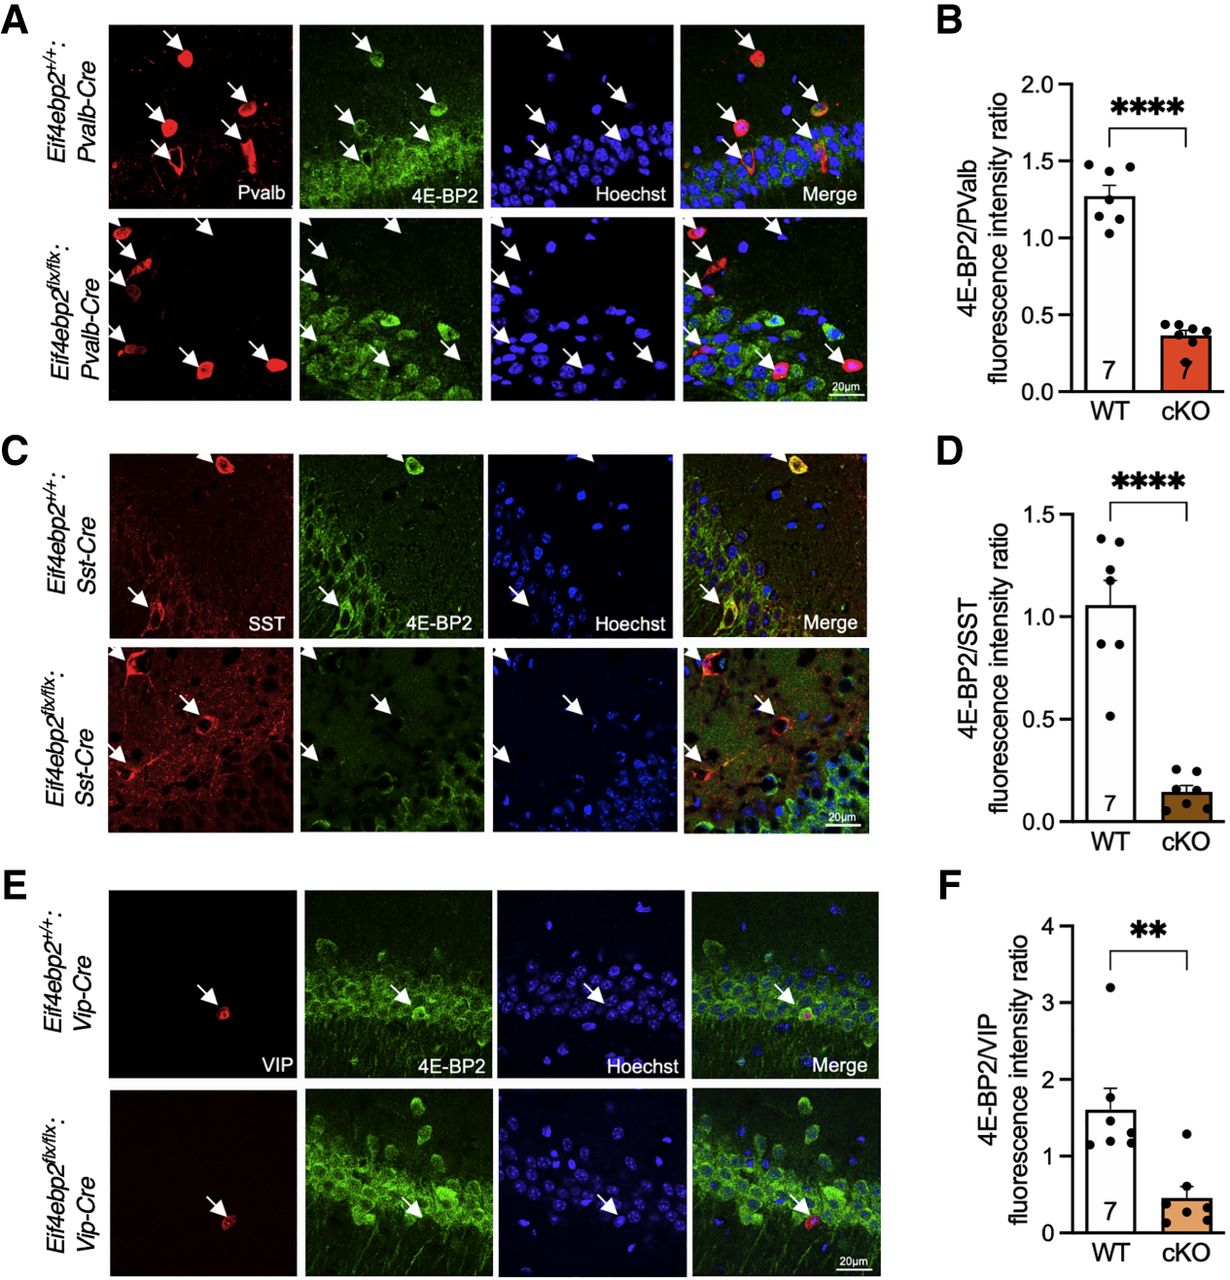
Confirmation of 4E-BP2 cKO in inhibitory neuron subclasses. (A) Immunofluorescence analysis of 4E-BP2 (green) in PValb-positive cells (red) in Eif4ebp2flx/flx:Pvalb-Cre versus Eif4ebp2+/+:Pvalb-Cre mice (n = 5). (B) Quantification (mean integrated density) of 4E-BP2 protein/PValb ratio from Eif4ebp2flx/flx:Pvalb-Cre versus Eif4ebp2+/+:Pvalb-Cre (cell number = 7). (C) Immunofluorescence analysis of 4E-BP2 (green) in SST-positive cells (red) in Eif4ebp2flx/flx:Sst-Cre versus Eif4ebp2+/+:Sst-Cre. (D) Quantification (mean integrated density) of 4E-BP2 protein/SST ratio from Eif4ebp2flx/flx:Sst-Cre versus Eif4ebp2+/+:Sst-Cre (cell number = 7). (E) Immunofluorescence analysis of 4E-BP2 (green) in VIP-positive cells (red) in Eif4ebp2flx/flx:Vip-Cre versus Eif4ebp2+/+:Vip-Cre. (F) Quantification (mean integrated density) of 4E-BP2 protein/VIP ratio from Eif4ebp2flx/flx:Vip2-Cre versus Eif4ebp2+/+:Vip-Cre (cell number = 7). Statistical significance: (**) P < 0.01, (****) P < 0.0001, calculated using an unpaired t-test. Confocal microscopy images: scale bar, 20 µm, magnification 60×. Cell nuclei were stained with Hoechst (blue).



