


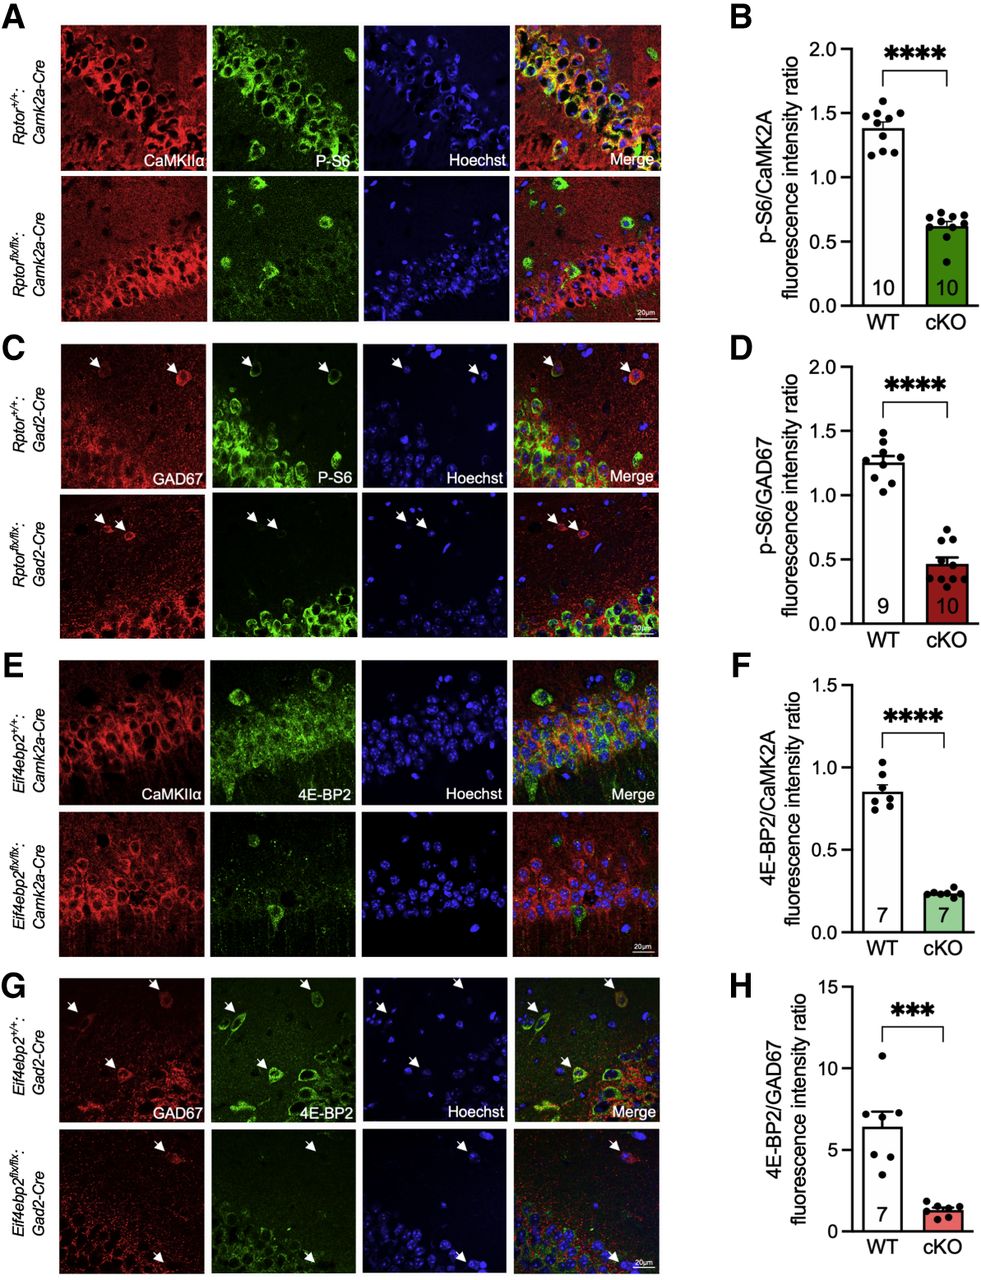
Validation of Raptor and 4E-BP2 deletion in CaMK2A and GAD67 positive neurons. (A) Immunofluorescence analysis of p-S6 (S240/244) (green) in CaMK2A+ cells (red) in Rptorflx/flx:Camk2a-Cre versus Rptor+/+:Camk2a-Cre (n = 5). (B) Quantification (mean integrated density) of p-S6 (240/244)/CaMK2A ratio from Rptorflx/flx:Camk2a-Cre versus Rptor+/+:Camk2a-Cre mice (cell number = 10). (C) Immunofluorescence analysis of p-S6 (240/244) (green) in GAD67-positive cells (red) in Rptorflx/flx:Gad2-Cre versus Rptor+/+:Gad2-Cre (mice = 5). (D) Quantification (mean integrated density) of p-S6 (240/244)/Gad67 ratio from Rptorflx/flx:Gad2-Cre versus Rptor+/+:Gad2-Cre mice (cell number = 9,10, respectively). (E) Immunofluorescence analysis of 4E-BP2 (green) in CaMK2A+ cells (red) in Eif4ebp2flx/flx:Camk2a-Cre versus Eif4ebp2+/+:Camk2a-Cre. (F) Quantification (mean integrated density) of 4E-BP2 protein/CaMK2A ratio from Eif4ebp2flx/flx:Camk2a-Cre versus Eif4ebp2+/+:Camk2a-Cre (cell number = 7). (G) Immunofluorescence analysis of 4E-BP2 (green) in GAD67-positive cells (red) in Eif4ebp2flx/flx:Gad2-Cre versus Eif4ebp2+/+:Gad2-Cre. (Η) Quantification (mean integrated density) of 4E-BP2 protein/GAD67 ratio from Eif4ebp2flx/flx:Gad2-Cre versus Eif4ebp2+/+:Gad2-Cre (cell number = 7). Confocal microscopy images: scale bar, 20 µm; magnification 60×. Cell nuclei are stained with Hoechst (blue). Statistical significance: (***) P < 0.001, (****) P < 0.0001 calculated with an unpaired t-test. Data are presented as mean ± SEM.



