


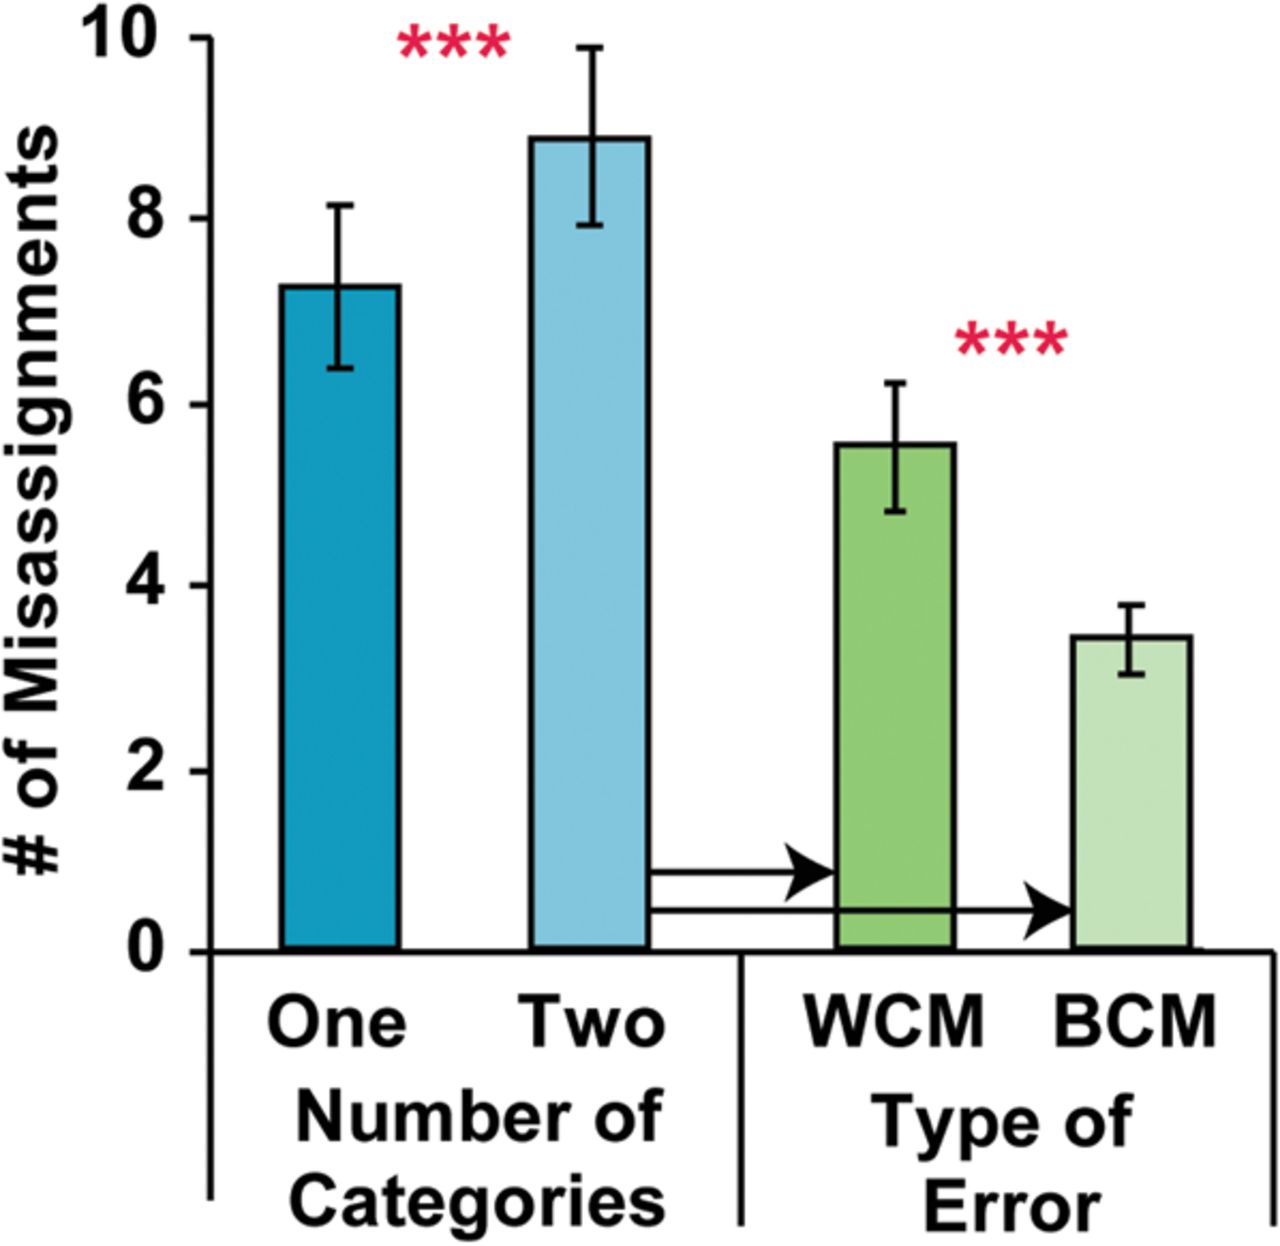
Figure 4.
Experiment 2 misassignment data. Total number of misassignment errors for one-category and two-category trials (blue bars) and misassignment errors for two-category trials separated into within-category misassignment (WCM) errors and between-category misassignment (BCM) errors (green bars). Plotted error bars indicate SEM. (***) P < 0.001.



