


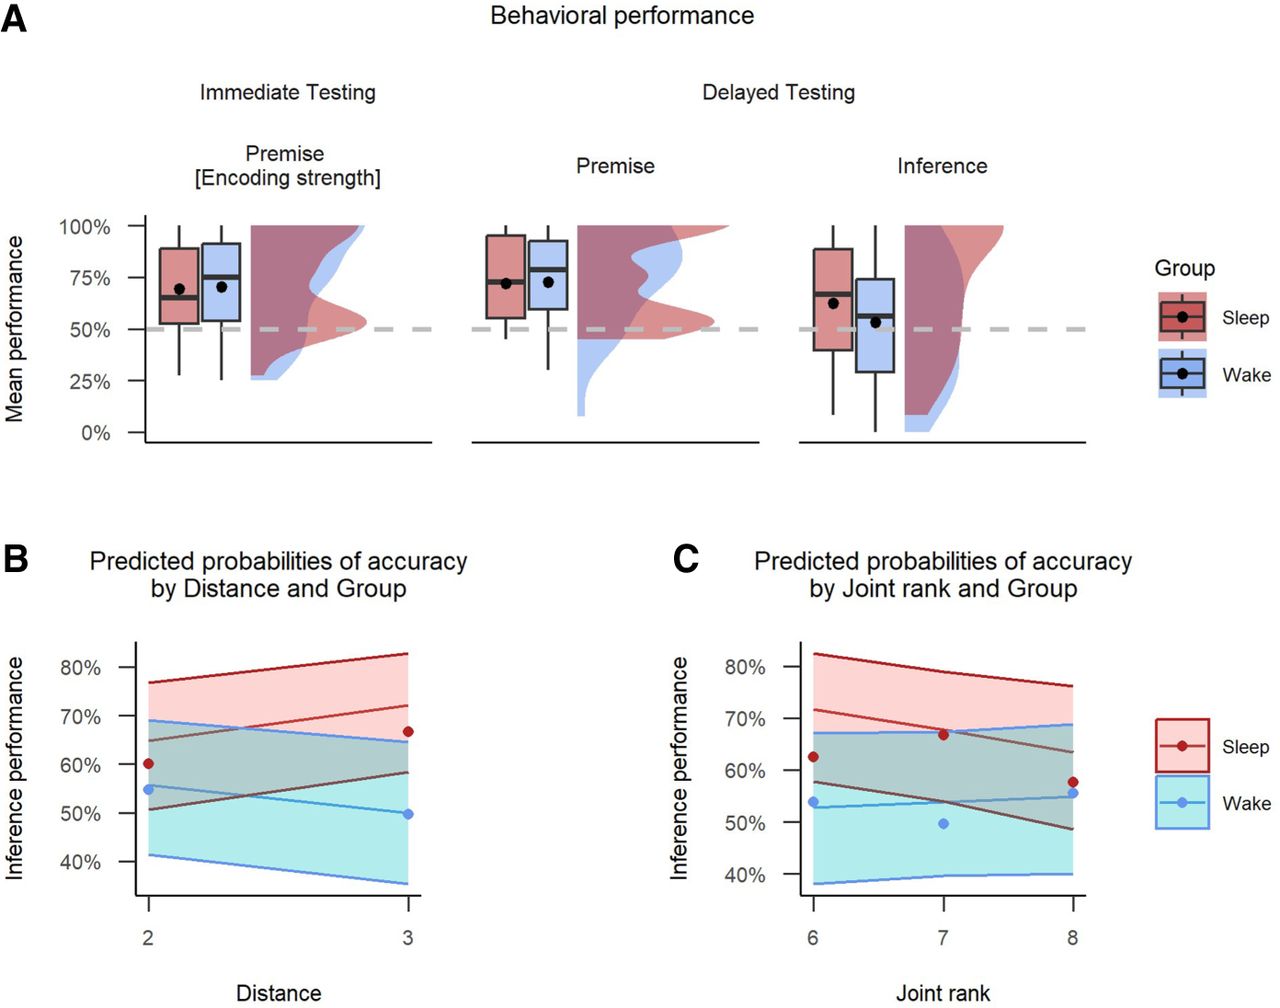
Figure 3.
Experiment 1. Behavioral performance and factors predicting inference accuracy at delayed test. (A) Rain cloud plot with mean and median performance across wake and sleep conditions. The dashed line represents chance performance at 50%, and the dot represents mean values. (B) Predicted probabilities of accuracy by distance and group, with distance levels of 2 and 3. (C) Predicted probabilities of accuracy by joint rank and group, with joint rank levels ranging from 6 to 8. In B and C, shadowed areas represent 95% confidence intervals.



