


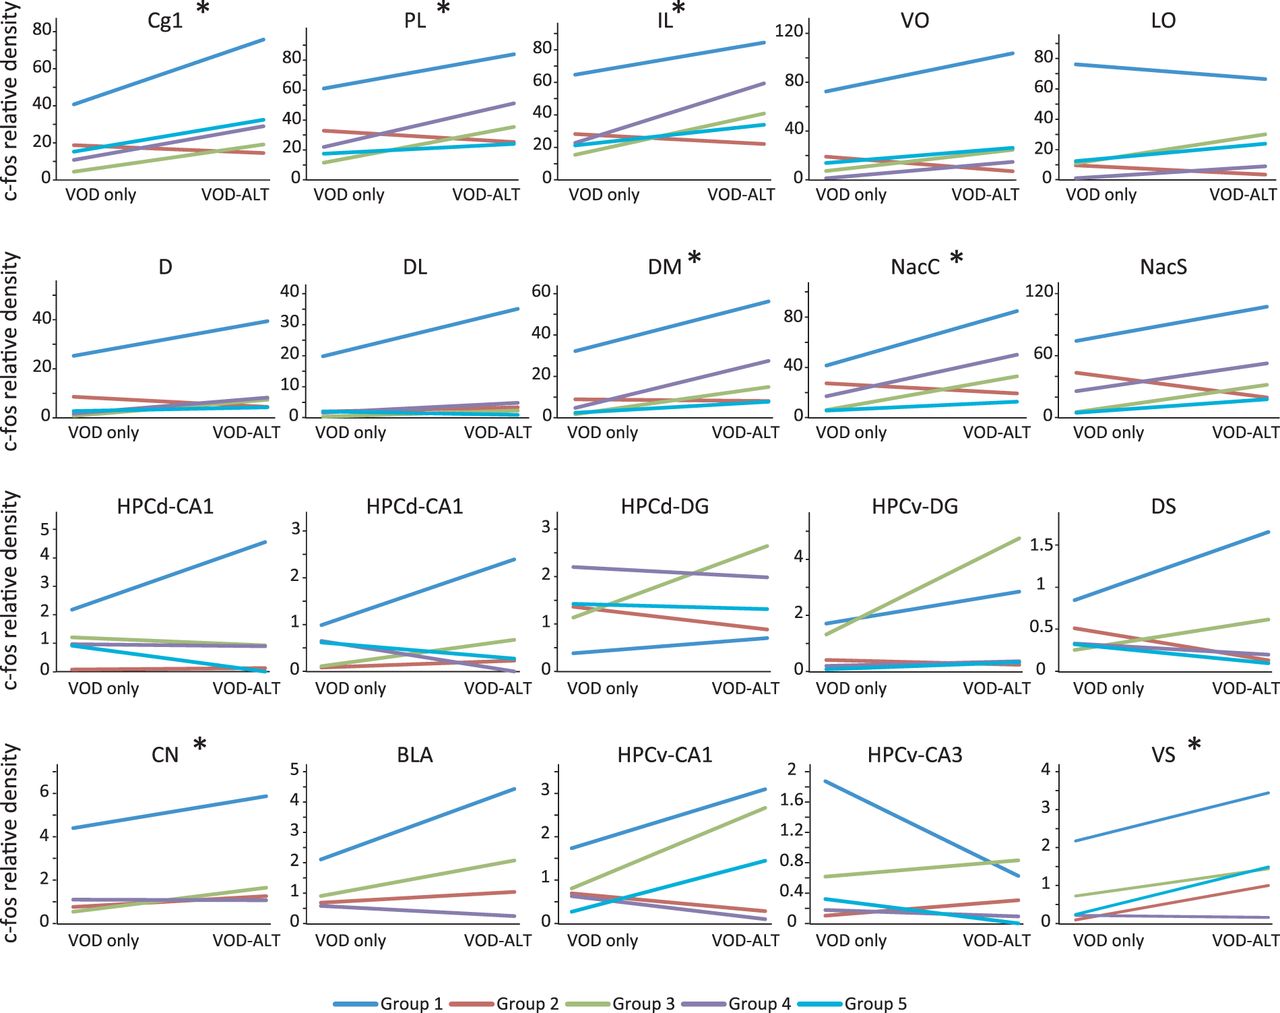
Figure 2.
Individual data for each cohort as shown in Figure 1G, with asterisks indicating the significant increases in Figure 1G. In the latter areas, the majority of the cohorts also show trends for increases. Abbreviations are the same as in Figure 1G.



