


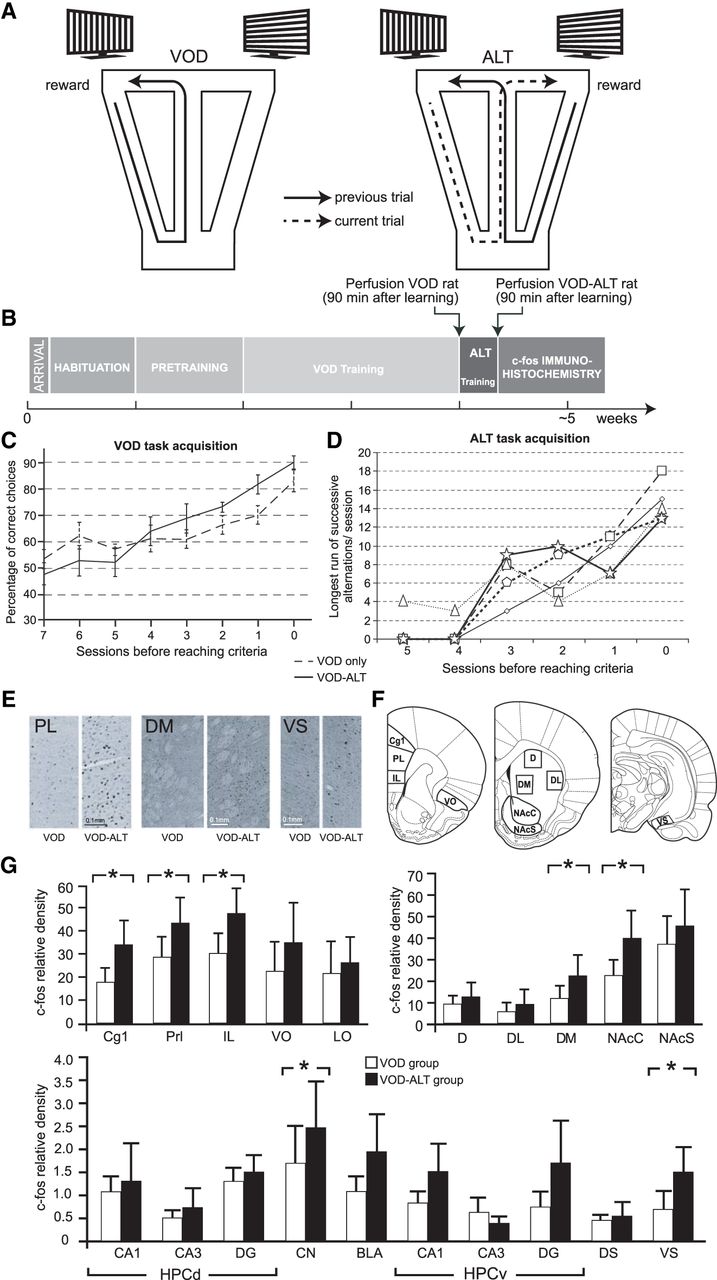
(A) As the rat crossed the middle of the central arm of the T-maze with return arms, cues appeared on the two screens. Correct choices were rewarded for going to the arm with vertical stripes in the VOD task and for going to the opposite arm from the previous trial in the ALT task. (B) Time course of experimental protocol for each cohort of rats. (C,D) Learning curves for the respective rats for the acquisition of the VOD task (C) and the ALT task (D). (E) Representative histological sections showing immunoreactive neurons. (F) Sites sampled for neuron counts (adapted from Paxinos and Watson 1998). (G) Relative density of c-fos immunoreactivity. (*) P < 0.05 significance in a one-tailed paired t-test for the five cohorts of rats. (Cg1) Cingulate area 1, (PL) prelimbic area, (IL) infralimbic area, (VO) ventral orbital cortex, (LO) lateral orbital cortex, (D) dorsal striatum, (DL) dorsolateral striatum, (DM) dorsomedial striatum, (NAcC) nucleus accumbens core, (NAcS) nucleus accumbens shell.



