


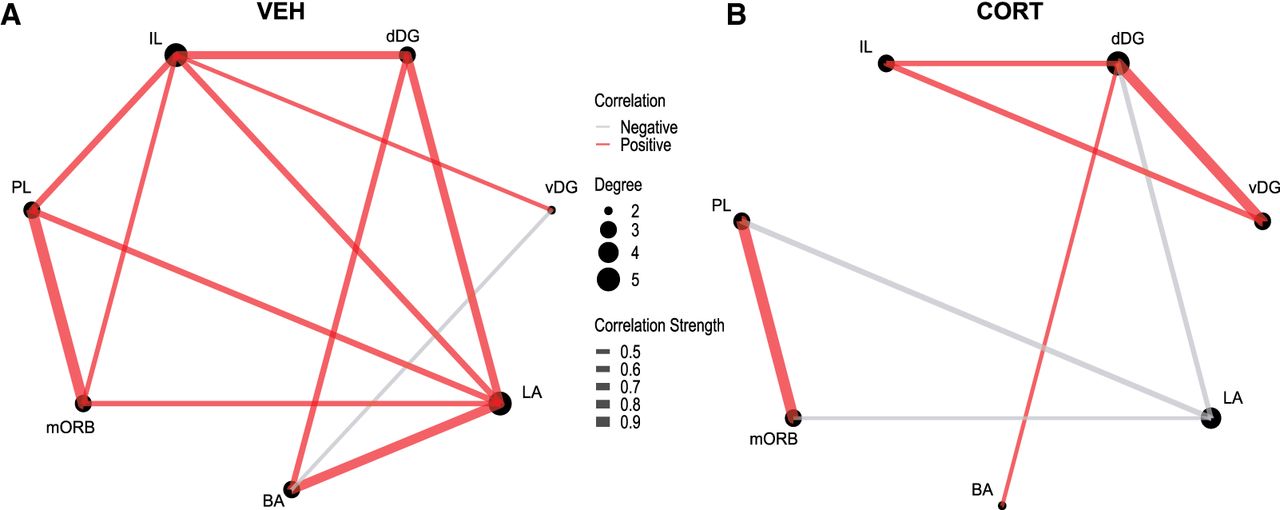
Figure 4.
Corticosterone altered network connectivity in remote auditory memory. Network connectivity graph of the VEH (A) and CORT (B) groups based on positive or negative Pearson's R values ≥ 0.5. Positive correlations are in red, and negative correlations are in gray. Connecting line thickness depicts R-value (scale middle), and node size is proportional to the degree of connections.



