


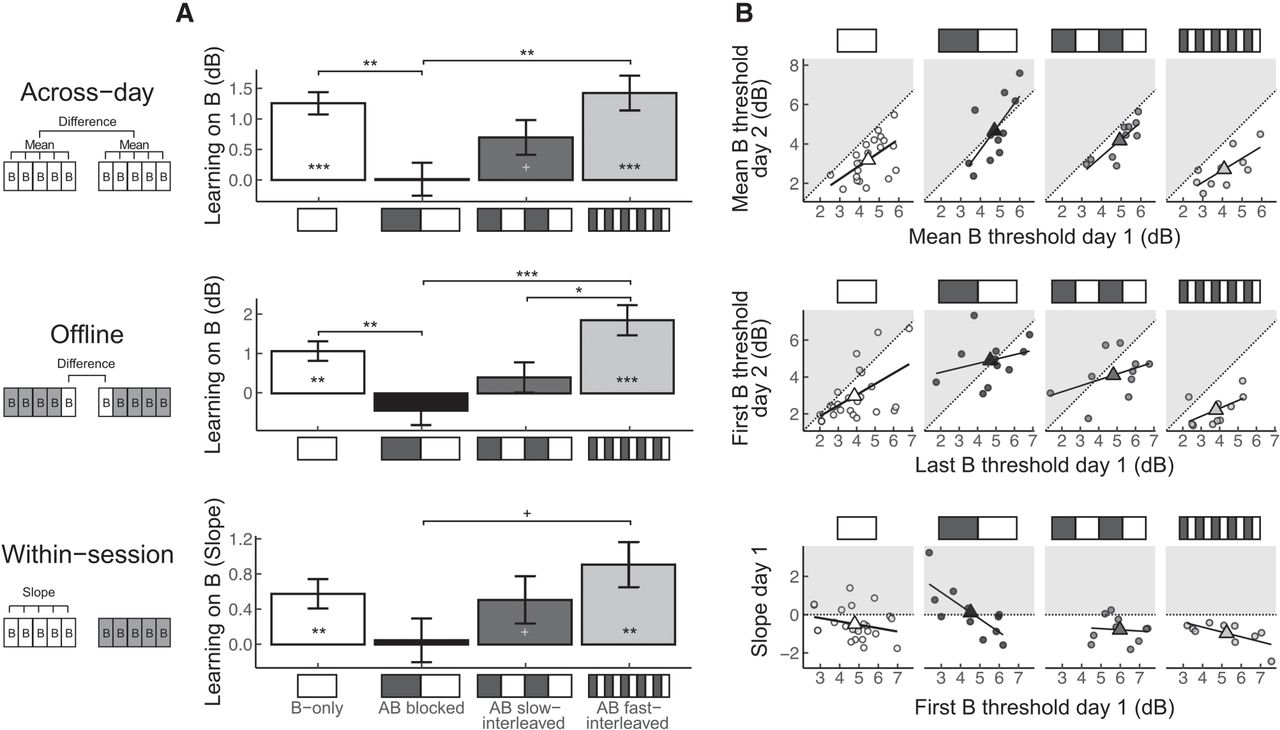
Learning on ILD discrimination (task B). (A) Group-level learning. Mean across-day (top row), offline (middle row), and within-session (bottom row) learning on task B for each of the four training regimens: B-only (white bars), AB-blocked (black bars), AB-slow-interleaved (dark-gray bars), and AB-fast-interleaved (light-gray bars). Learning magnitude is adjusted using the day 1 threshold as a covariate. Error bars represent plus or minus one standard error. Asterisks within a bar indicate statistically significant learning within a trained group. Asterisks between bars indicate a statistically significant difference in learning magnitude between trained groups. (+) P < 0.10, (*) P < 0.05, (**) P < 0.01, (***) P < 0.001. (B) Individual-level learning. Scatter plots of the individual (circles) and group mean (triangles) performance on task B showing the mean threshold across blocks on day 1 versus day 2 (across-day learning; top row), the last threshold on day 1 versus the first threshold on day 2 (offline learning; middle row), and the first threshold on day 1 versus the slope of the thresholds across all blocks on day 1 (within-session learning; bottom row). Results are shown separately for each training regimen: B-only (white symbols), AB-blocked (black symbols), AB-slow-interleaved (dark-gray symbols), and AB-fast-interleaved (light-gray symbols). Black lines represent the linear model fitted to the individual values in each panel. The dashed diagonal lines in the top two rows have a slope of 1, indicating no across-day and no offline learning. The dashed horizontal lines in the bottom row have an intercept of 0, indicating no within-session learning. Points below the dashed lines (unshaded regions) therefore represent individuals and groups that improved, while points above the dashed lines (shaded regions) represent individuals and groups that got worse.



