


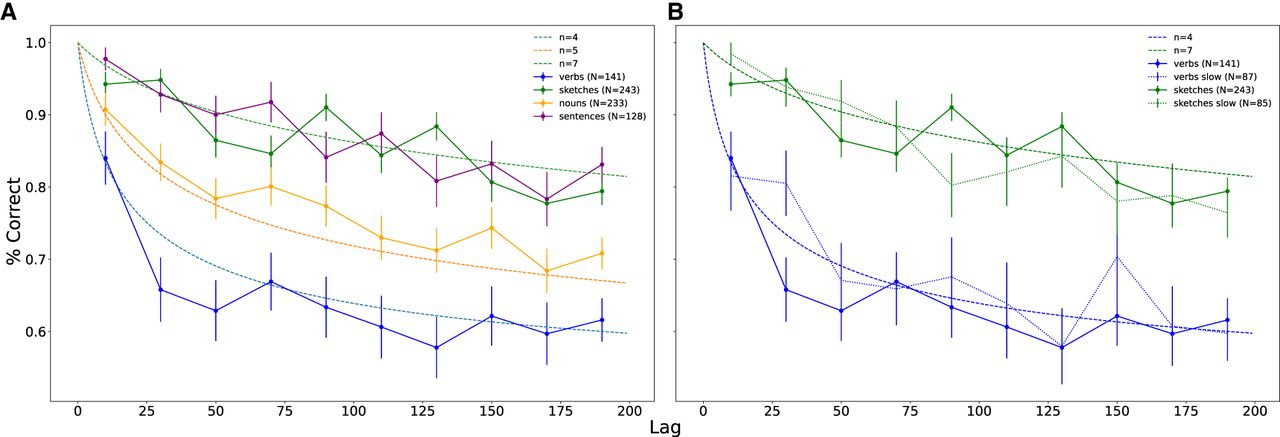
Experimental retention curves for lists of different types and corresponding theoretical curves with different parameter values. (A) Fraction of correct recognition versus number of stimuli between presentation and test, grouped into 10 equidistant bins, obtained from a 2AFC memory task on lists of 200 items for different types of material (verbs [blue], nouns [orange], sentences [purple], and sketches [green]) with a presentation speed of 1 sec (where the stimulus is shown) plus a 0.5-sec interitem interval (blank screen). (B) Similar to A for verbs and sketches with two different presentation speeds. The solid lines represents the results for verbs and sketches as they appear in A, while the dotted lines represent the same experiment as in A but with a presentation speed of 2 + 0.5 sec. The data obtained from a longer presentation time do not differ substantially from their faster counterparts. In both plots, the dashed lines correspond to theoretical curves produced by our retroactive interference model for different values of the dimensionality parameter n (blue: n = 4, orange: n = 5, and green: n = 7). The number of participants contributing to each curve is denoted by the value of N in the bracket next to each category.



