


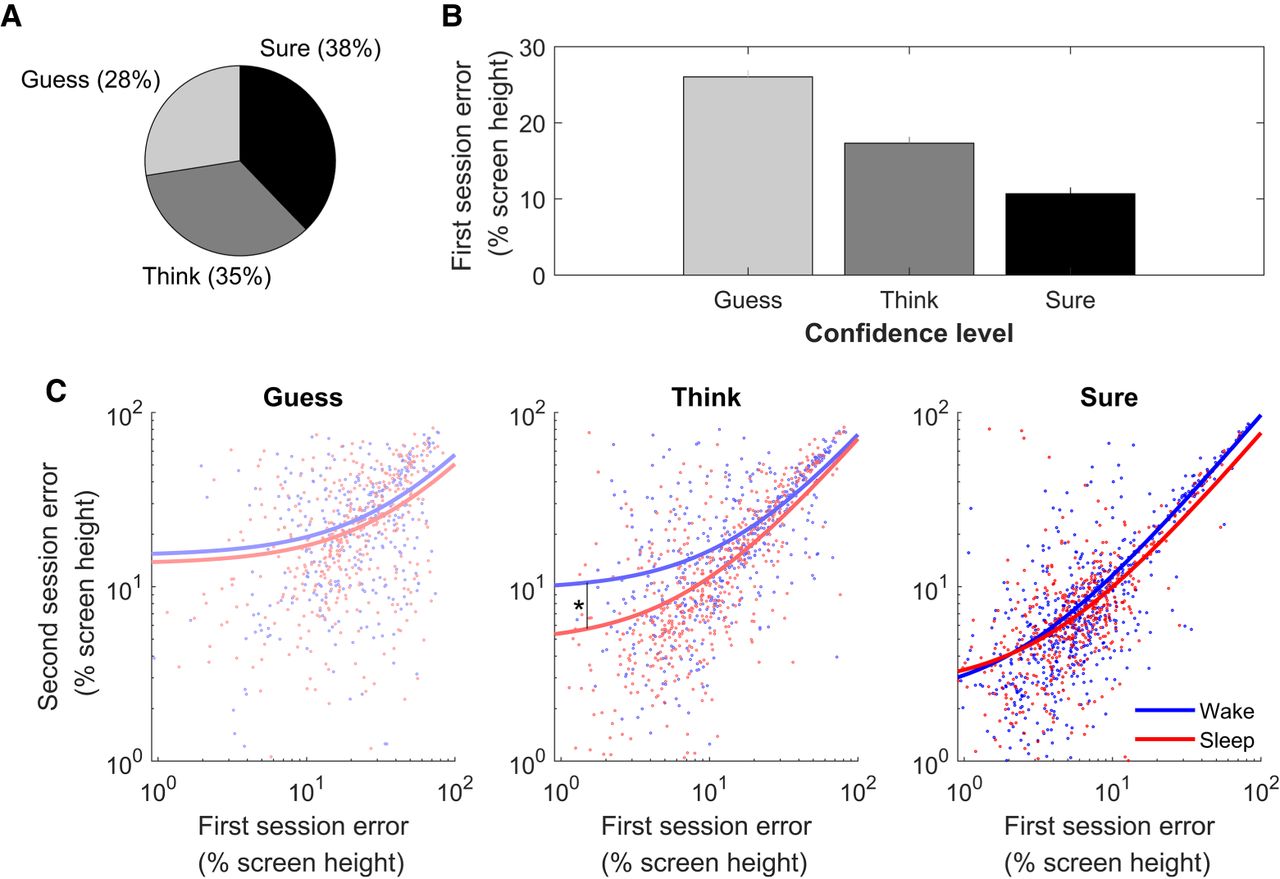
Memories recalled at moderate confidence levels benefited from sleep. (A) Distribution of confidence as rated by participants. (B) Average error rates for each confidence level. Error bars represent standard errors of the mean for all objects. (C) The effects of sleep on memory for objects rated with different confidence levels. Graphs show the error rates for the first and second sessions on the X- and Y-axes, respectively (log–log scale). Each dot represents a single object, pooled across participants. The lines show the linear correlation between first and second session errors (note that lines seem curved due to the log–log axes). For objects with intermediate confidence level, the sleep group showed significantly lower postsleep errors. (*) P < 0.05.



