


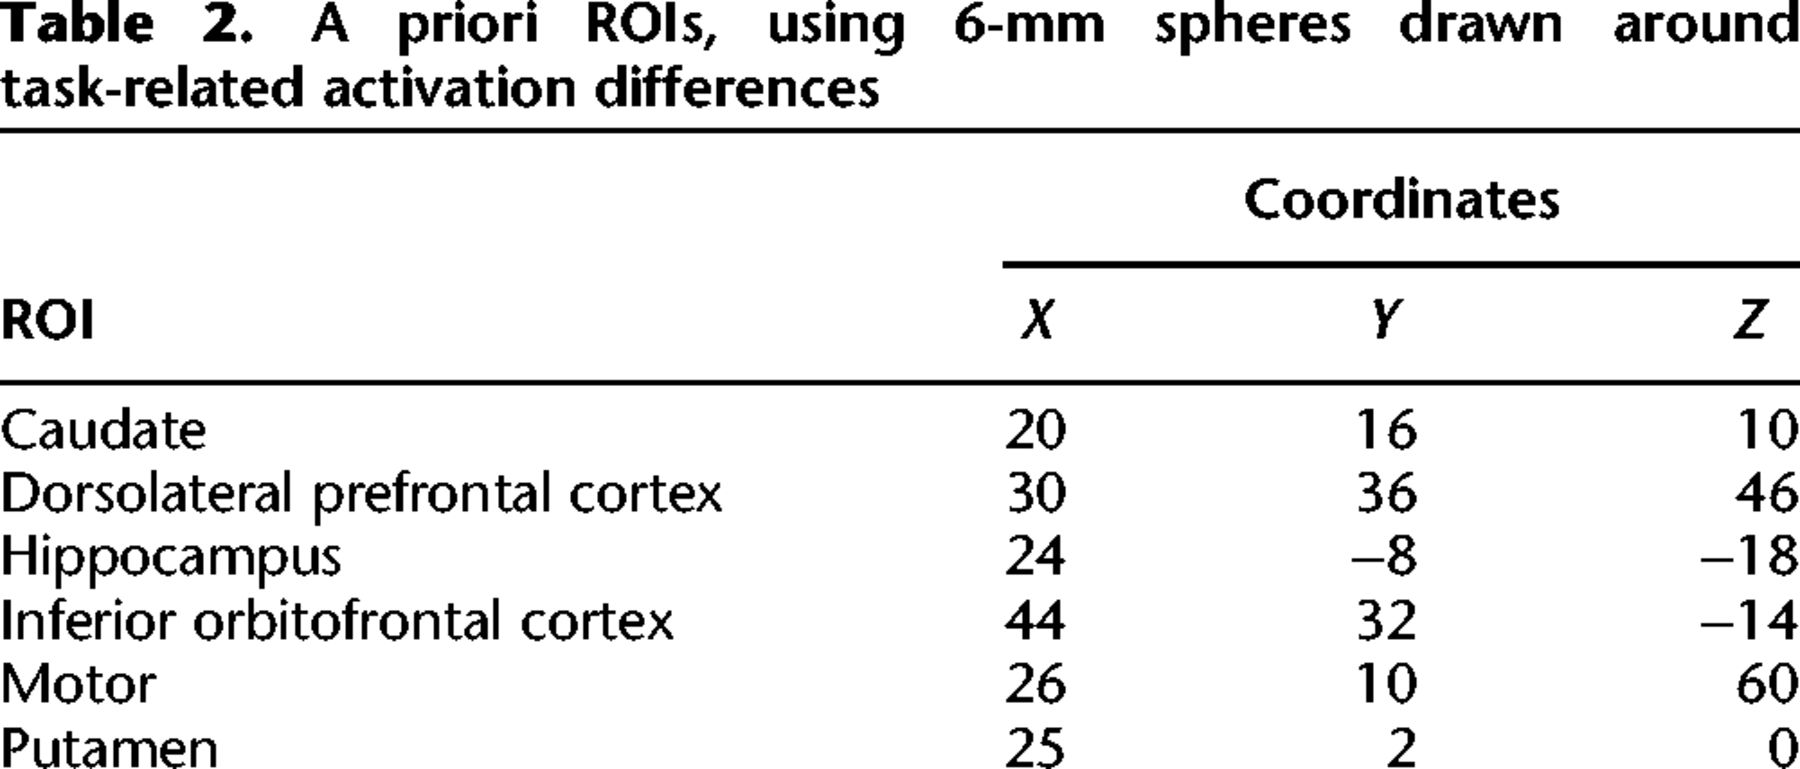
Table 2.
A priori ROIs, using 6-mm spheres drawn around task-related activation differences
Click on table to view larger version.
Click on image to view larger version.
A priori ROIs, using 6-mm spheres drawn around task-related activation differences
Click on table to view larger version.
 CiteULike
 Delicious
 Digg
Digg Facebook
 Reddit
 Twitter
