


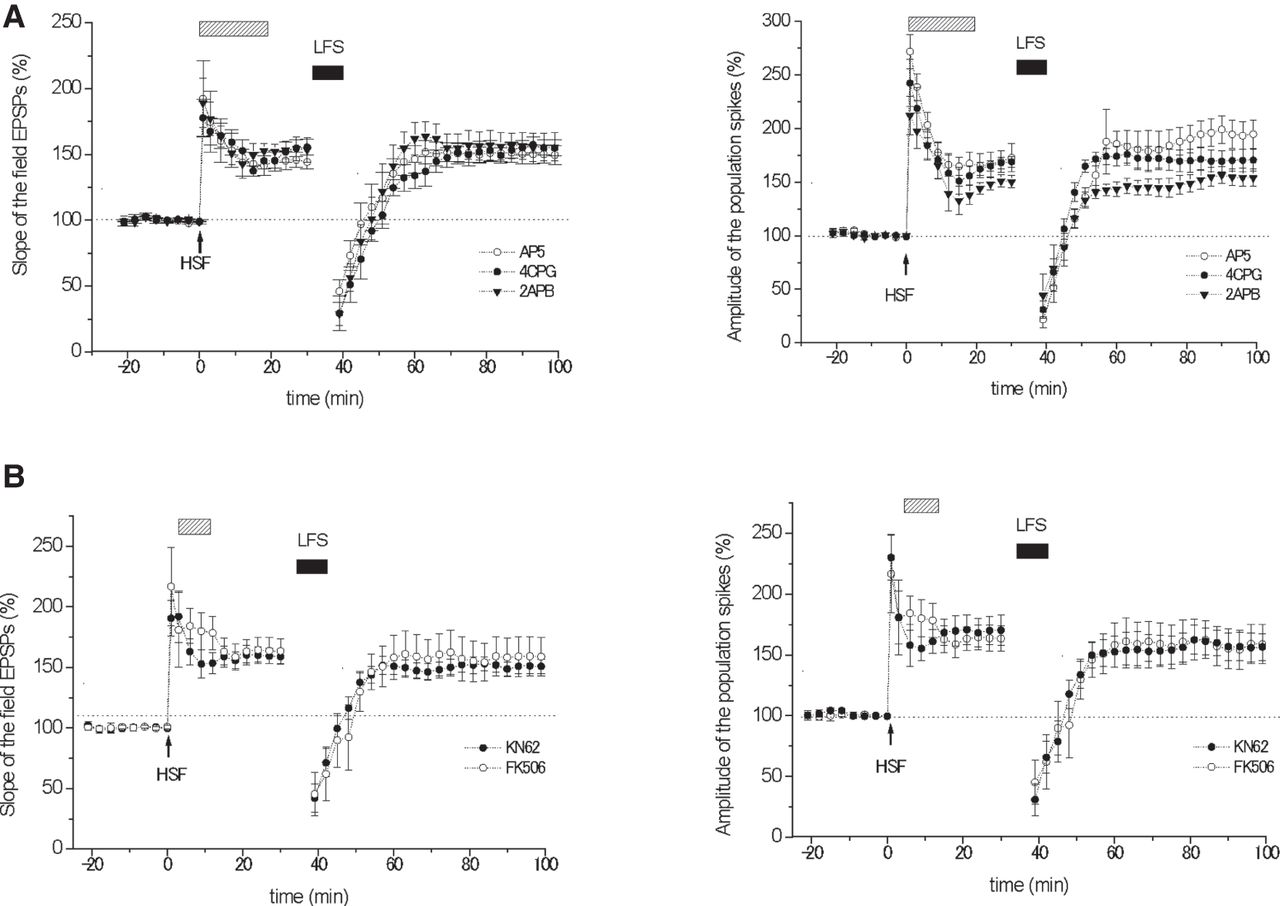
Involvement of NMDARs, mGluRs, group I mGluRs, IP3Rs, CaMKII, or calcineurin activated after HFS in the induction of depotentiation. (A) Summarized results for the time course of depotentiation in the S-EPSP (left panel) or A-PS (right panel) when 50 µM AP5 (n = 5, unfilled circles), 100 µM S-4CPG (n = 5, filled circles), or 10 µM 2-APB (n = 5, filled triangles) was applied to the perfusate (hatched bar) in the presence of test synaptic stimulation during the 19-min period from 1 to 20 min after HFS (arrow) before the subsequent LFS (black bar). (B) Summarized results for the time course of depotentiation in the S-EPSP (left panel) or A-PS (right panel) when 10 µM KN-62 (n = 6, filled circles) or 1 µM FK506 (n = 6, unfilled circles) was applied to the perfusate (hatched bar) in the presence of test synaptic stimulation during the 10-min period from 1 to 11 min after the end of LFS (black bar).



