


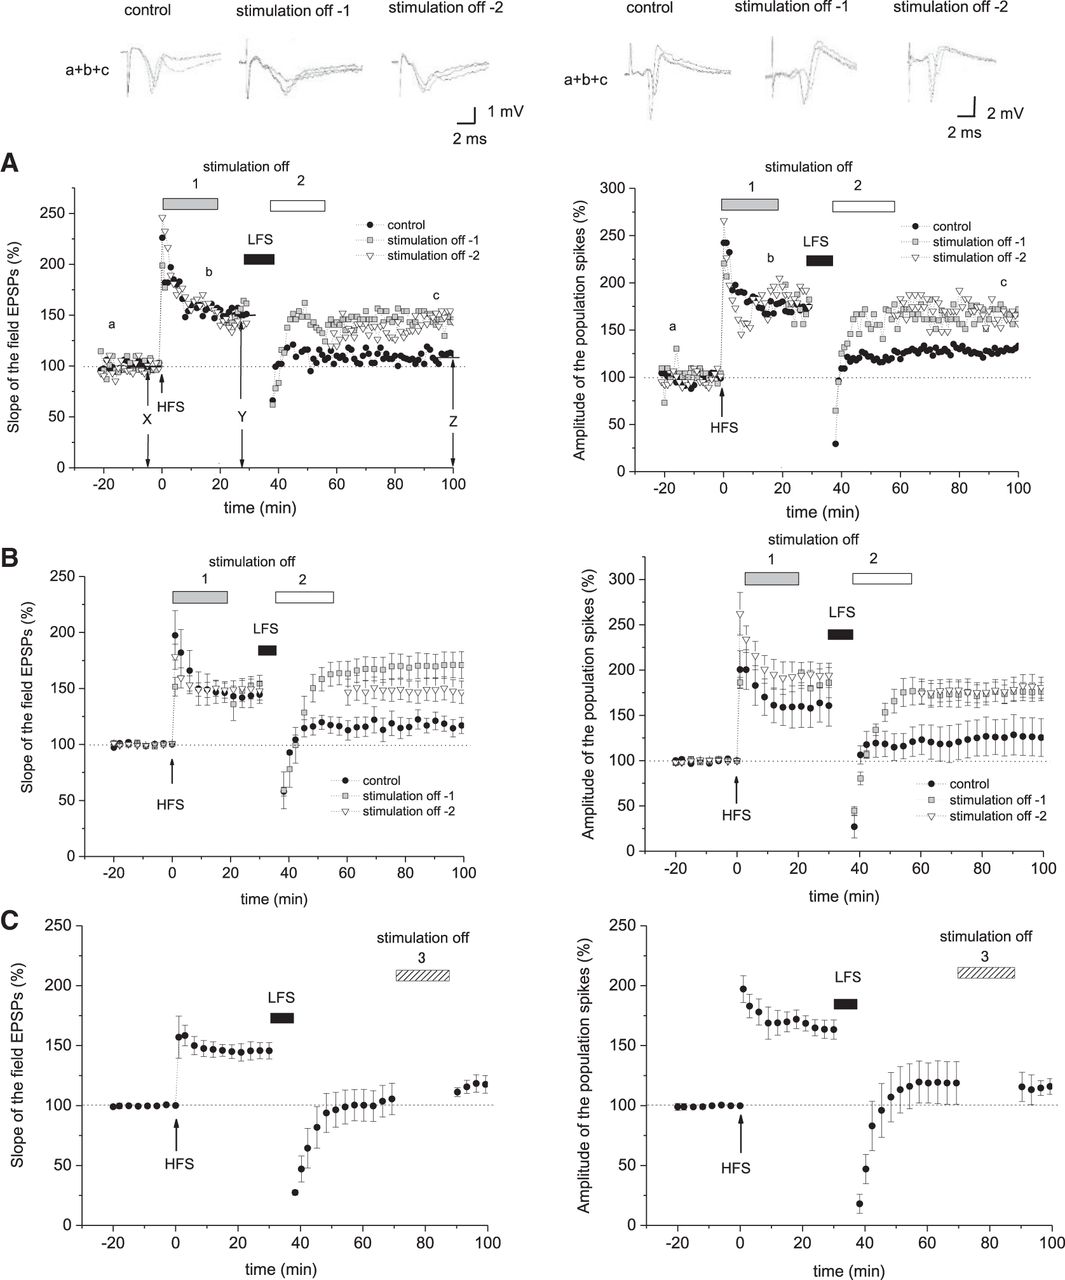
Effect of stopping test synaptic stimulation after HFS or LFS on depotentiation. Typical example (A) and summarized time course (B) for the change in the S-EPSP (left panel) or A-PS (right panel) in response to a single train of LFS (1000 pulses at 2 Hz) (horizontal black bar) applied at 30 min after HFS (100 pulses at 100 Hz) (arrow). The sample traces above the main panel were taken at the times indicated as a, b, and c in A. In the control, test synaptic stimulation was applied throughout the experiment (filled circles), while the horizontal gray or white bar represents, respectively, stopping test synaptic stimulation at 0.05 Hz for the 19-min period from 1 to 20 min after HFS (gray squares, stimulation off-1) or for the 20-min period from 0 to 20 min after the end of LFS (unfilled triangles, stimulation off-2). In (B), n = 7 for the control and n = 6 for the other two traces. (C) Summarized time course for the change in the S-EPSP (left panel) or A-PS (right panel) in response to a single train of LFS (1000 pulses at 2 Hz) (horizontal black bar) applied at 30 min after HFS (100 pulses at 100 Hz) (arrow). The horizontal white bar represents stopping test synaptic stimulation for the 20-min period at 30–50 min after HFS (stimulation off-3). n = 6. X, Y, or Z in A represents the averaged value for the 10-min period immediately prior to HFS or LFS, the averaged value at 5–0 min immediately before LFS, and the stable level at 55–60 min after the end of LFS of the responses, respectively.



