


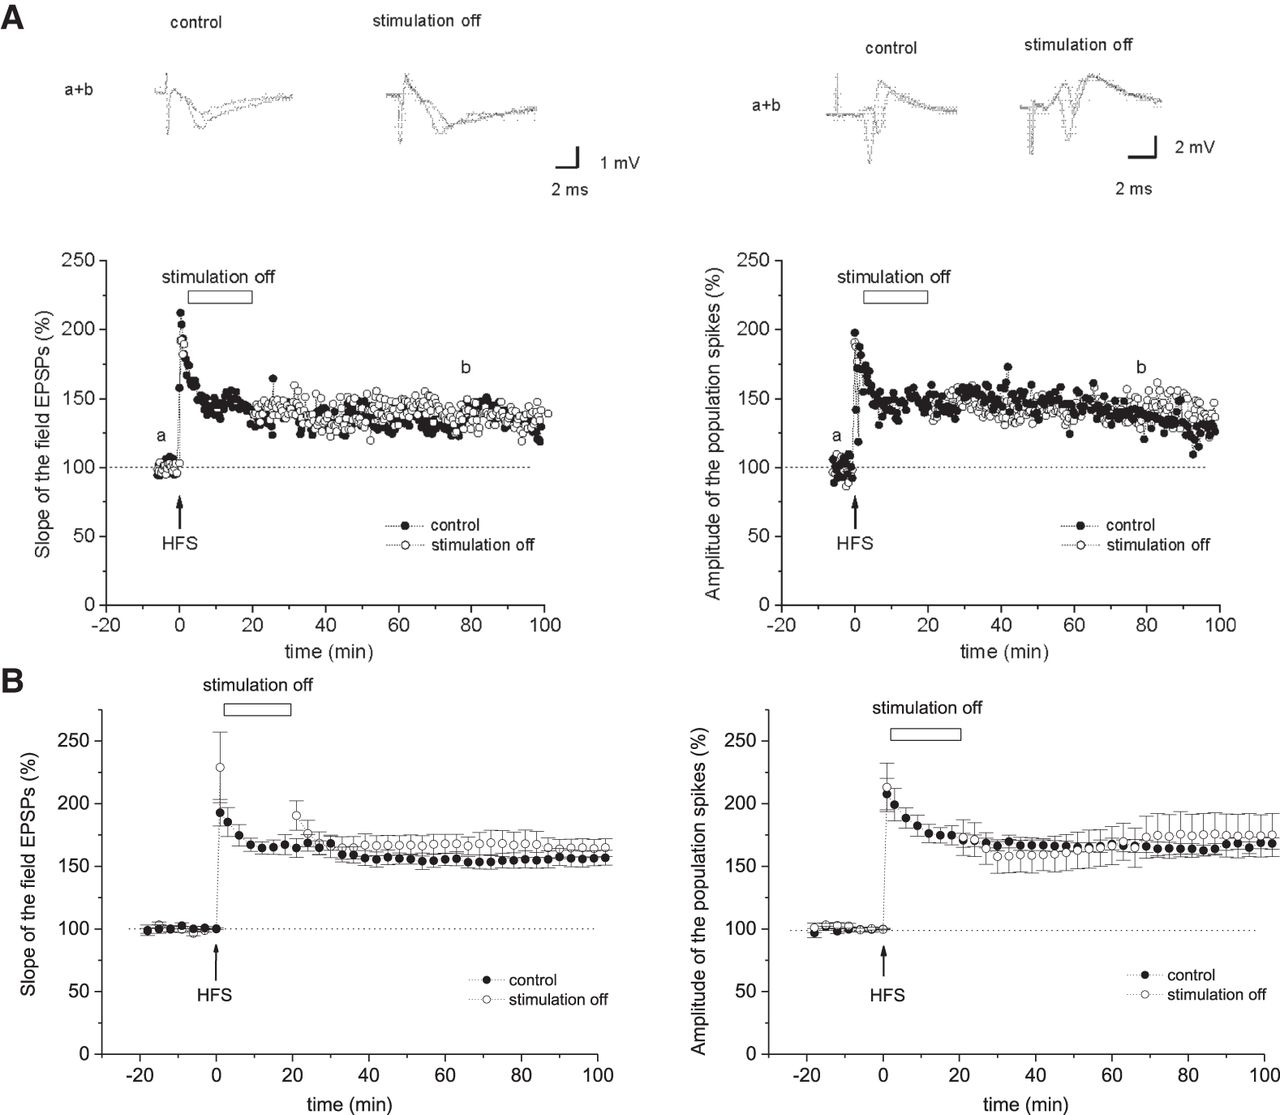
Effect of stopping test synaptic stimulation immediately after HFS on LTP induction. (A) Sample waveforms and a typical time course of LTP in the S-EPSP (left panel) or A-PS (right panel) induced by HFS (100 pulses at 100 Hz) when test synaptic stimulation at 0.05 Hz was either continued throughout the experiment (control) or was stopped for the 19-min period of 1 to 20 min after HFS (stimulation off). The sample waveforms were taken at the times indicated as a and b in the time course figure. (B) Summarized time course for the change in the S-EPSP (left panel) or A-PS (right panel) induced by HFS (100 pulses at 100 Hz) when test synaptic stimulation was either continued throughout the experiment (control, n = 7) or was stopped for the 19-min period of 1 to 20 min after HFS (stimulation off, n = 6). The horizontal bar marks the stimulation-off period and the arrow represents the application of HFS. In these, and all subsequent time course figures, the ordinate shows the S-EPSP or A-PS expressed as a percentage of the averaged value measured during the 10-min period before HFS. The symbols and bars represent the mean ± S.E.M.



