


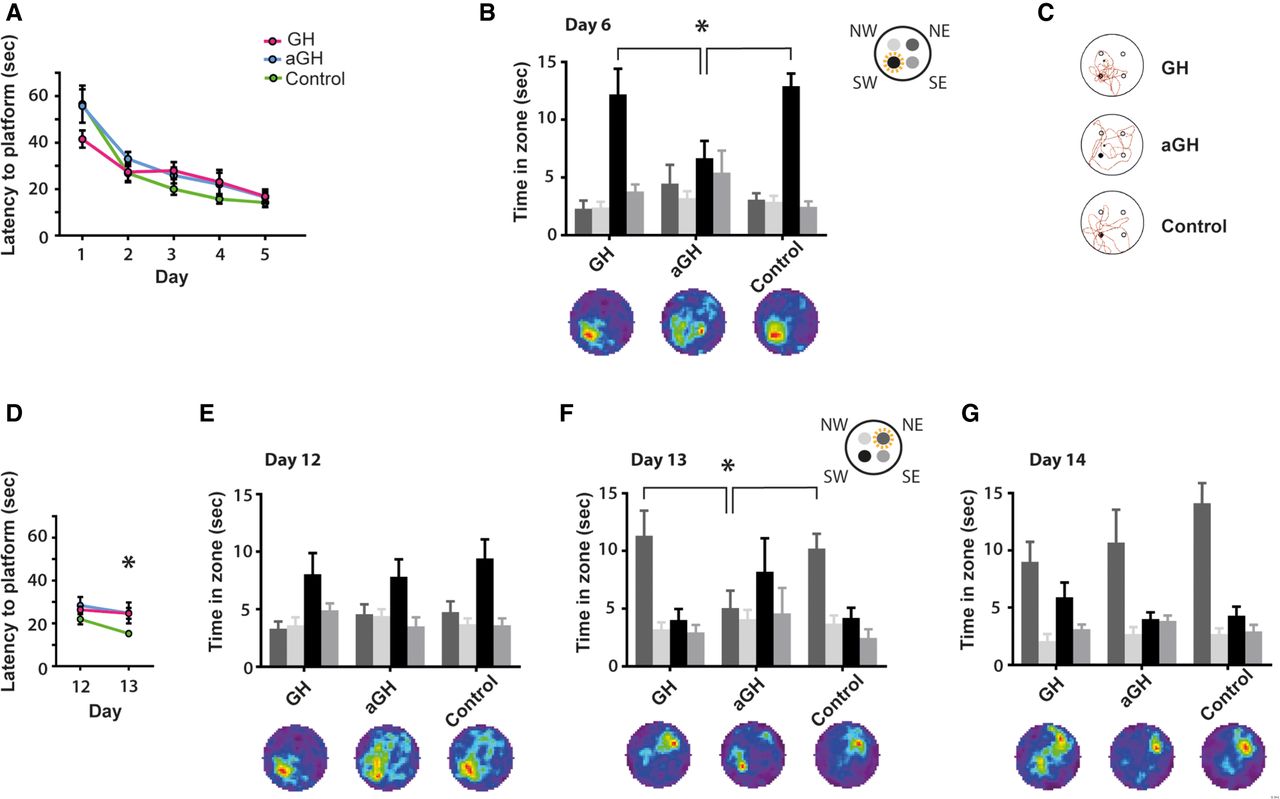
Antagonizing growth hormone (aGH) in the dorsal hippocampus impairs memory in the water maze. (A) Latencies on initial training on day 1–5 to the target zone southwest (SW). n = 8 GH, n = 8 aGH, n = 13 controls. (B) Search patterns during the 60 sec probe trial on day 6: The histogram of time spent in four 50 cm diameter zones shows that the aGH treated animals spent less time in the platform zone than the GH treated and control animals (post-hoc orthogonal comparisons of aGH versus the two other groups, t(26) = 2.95, P < 0.004). The upper right figure illustrates the zones; the target zone SW (yellow dotted circle), southeast (SE), northeast (NE), and northwest (NW). The occupancy maps below illustrate the average search pattern for each group. Red in the occupancy maps indicates the most time spent in that location, while dark blue indicates the least time spent in that part of the water maze. (C) Representative individual swim paths on probe test day 6 for the GH, aGH, and control group, respectively. (D) Latencies during reversal training, same animals as in A. (E) Search pattern for probe trial on day 12, at initiation of reversal training. All groups remembered the platform location SW equally (two-way ANOVA effect of Zone × Group F(6,78) = 0.48, P = 0.82). Occupancy maps below illustrate that all groups spent the most time in the SW zone. (F) Probe trial on day 13, the GH and control animals spent more time near the new NE goal location than aGH (post-hoc orthogonal comparisons of aGH vs the two other groups t(26) = 2.69, P = 0.006). The aGH group tended to search for the old platform location. The upper right figure illustrates the platform zones with the new target zone NE (yellow dotted circle). Occupancy maps below illustrates that GH and control animals spent the most time in NE zone, while aGH animals spent the most time in the SW zone. (G) After 2 d of training, on day 14, all groups searched for the novel platform location (two-way ANOVA F(3,75) = 22.98; P < 0.001, but no Zone × Group interaction P > 0.25). Occupancy maps below illustrate that all the groups spent the most time in the NE zone, although the GH animals also spent time searching for the old goal location (SW).



