


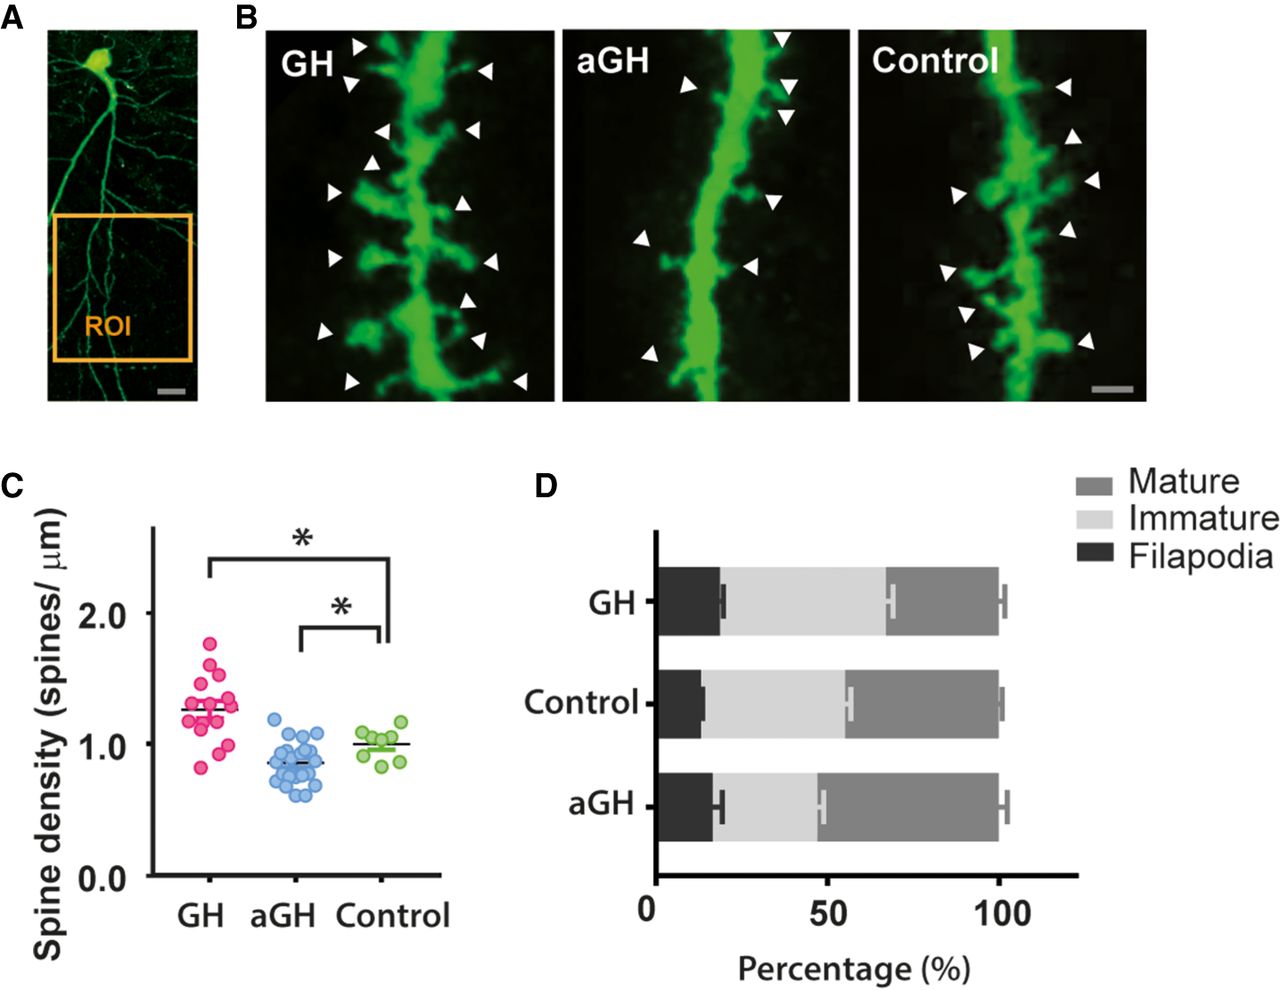
Growth hormone (GH) increases the density of dendritic spines in CA1, while antagonizing GH (aGH) reduced the spine density. (A) Example of green fluorescent protein (GFP) labeled pyramidal cell in CA1. Spines 100–200 µm from the soma (region of interest [ROI]; orange frame) on apical dendrites were used in the analysis when the entire neuron was traceable. Scale bar 20 µm. (B) Representable segments of dendrites with spines in the GH, aGH, and control group, respectively. Scale bar 1 µm. (C) Average spine density for individual spine segments (each dot) was highest in GH treated animals, while aGH had lower spine density than the other group (n = 15 in three GH treated animals, n = 22 spine counted regions in four aGH animals, and n = 8 in three control animals; Jonckheere–Terpstra test, JT = 32, P = 0.003). (D) The distribution of spine morphologies (filipodia, immature or mature) shown in percentages. GH animals had more immature spines than controls (one-way ANOVA F(2,42) = 23.7, P < 0.001, t-test, P = 0.036) while aGH had less immature spines than controls (t-test, P < 0.001). On the other hand, aGH increased the percentage of mature spines (one-way ANOVA F(2,42) = 23.7, P < 0.001, t-test, P = 0.019) while mature spines were decreased after GH treatment (t-test, P = 0.003).



