


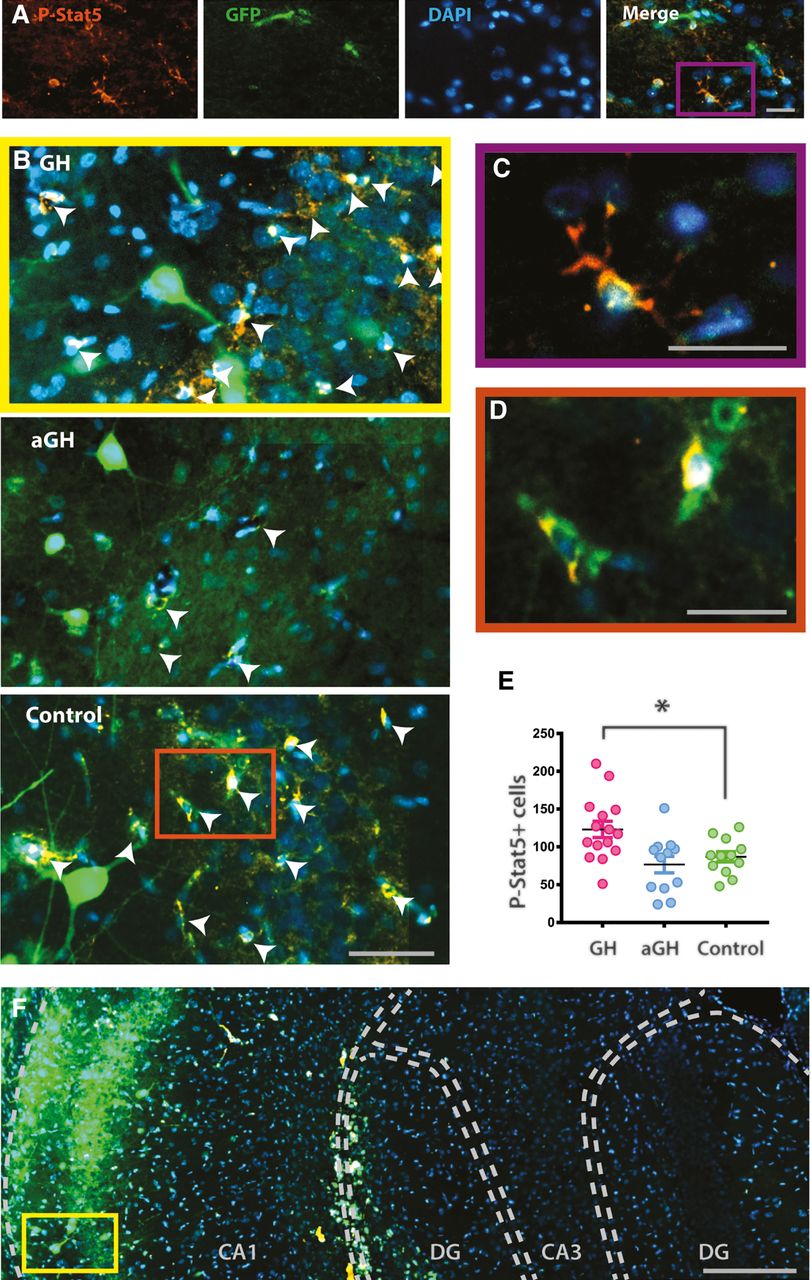
Growth hormone (GH) receptor activation quantified by p-Stat5 in the hippocampus. (A) Examples of p-Stat5 signal (red), green fluorescent protein (GFP; green), DAPI (blue), and merged in a control animal. Scale bar 20 µm. (B) Representative sections from a GH treated animal (close-up from illustration in F, yellow frame), aGH treated animal, and control animal, with p-Stat5, GFP, and DAPI. Scale bar 50 µm. (C) Illustration of a p-Stat5 positive DAPI cell, close-up from the merged illustration in A (purple frame). Scale bar 20 µm. (D) Illustration of two p-Stat5 positive, GFP positive DAPI cells (merged green and red becomes yellow), close-up from the example control animal in B (orange frame). Scale bar 20 µm. (E) The amount of p-Stat5 in the GH, aGH, and control group: GH significantly increased the number of p-Stat5 positive DAPI cells (ANOVA F(2,36) = 6.33, P = 0.004, t-test P = 0.013), but p-Stat5 in the aGH group was not significantly lower than in controls. (F) Cross section overview of hippocampus from the GH treated animal in B, showing p-Stat5, GFP, and DAPI. GFP labeling is seen most dense in injection area CA1. Scale bar 200 µm.



