


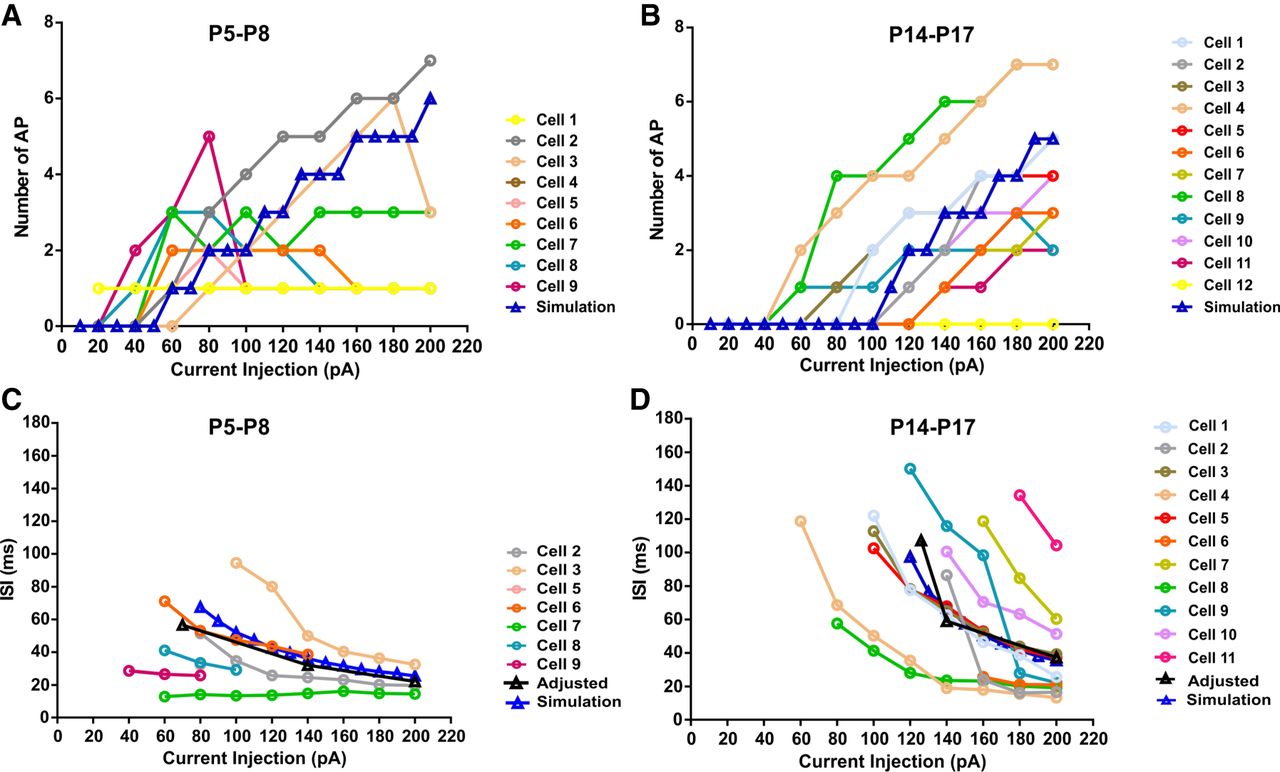
Representative results of current-clamp analysis and simulation of experimental data. Current injection versus the number of AP from individual pyramidal cells in current-clamp recording at (A) P5–P8 and at (B) P14–P17. Colors represent different pyramidal cells measured in intervals of 20 pA. Note the variability in cell response for different current injections. The blue curve represents the simulated data based on the adjusted curve. (C) Current injection versus interspike interval (ISI) from individual pyramidal cells at P5–P8 and at (D) P14–P17 in a 200 msec window recording. Each point and color represents the value of each individual pyramidal cell obtained in current-clamp recording from cells with two or more spikes in a given current injection. The black curve (triangle) represents three adjusted points chosen to represent the experimental ISI mean curve for each age group (C,D).



