


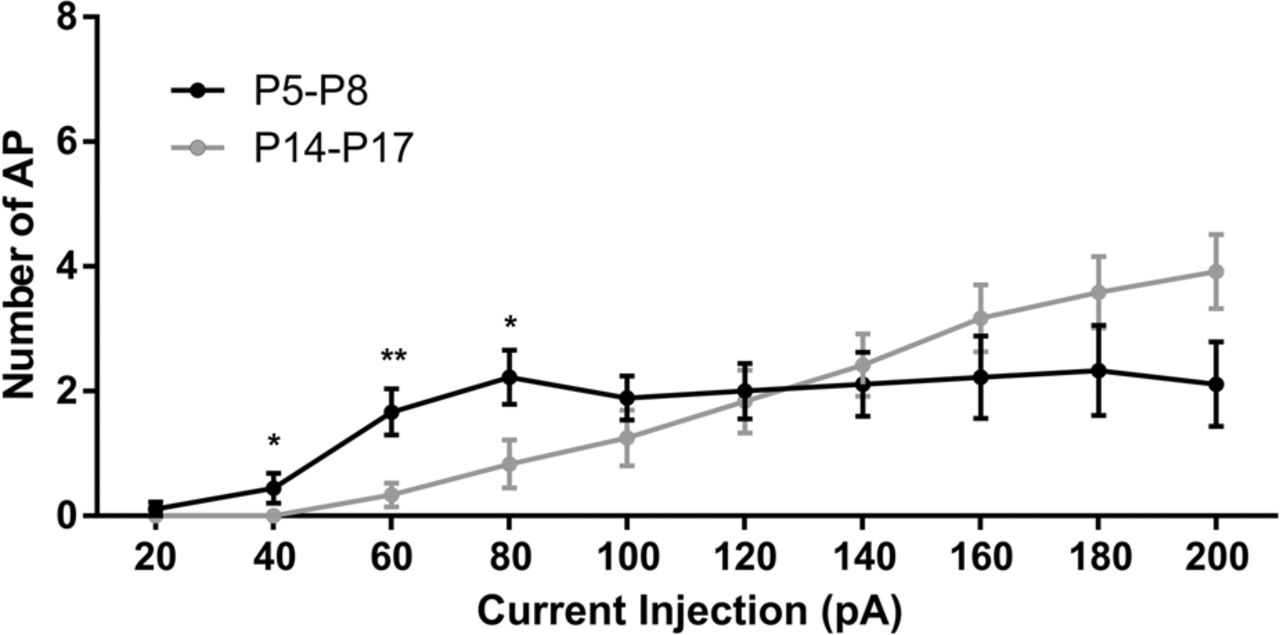
Figure 1.
Number of AP-current injected curves of aPC L2/3 pyramidal cells in P5–P8 and P14–P17age rat pups. A relationship between the average number of AP and intensity of injected current (pA) in a 200 msec window recording in brain slices from P5–P8 (black curve, n = 9 cells) and P14–P17 (gray curve, n = 12 cells) aged pup rats. Asterisks represent statistically significant unpaired Student's t-test comparisons between P5–P8 and P14–P17 at each current intensity. (*) P < 0.05; (**) P < 0.01.



