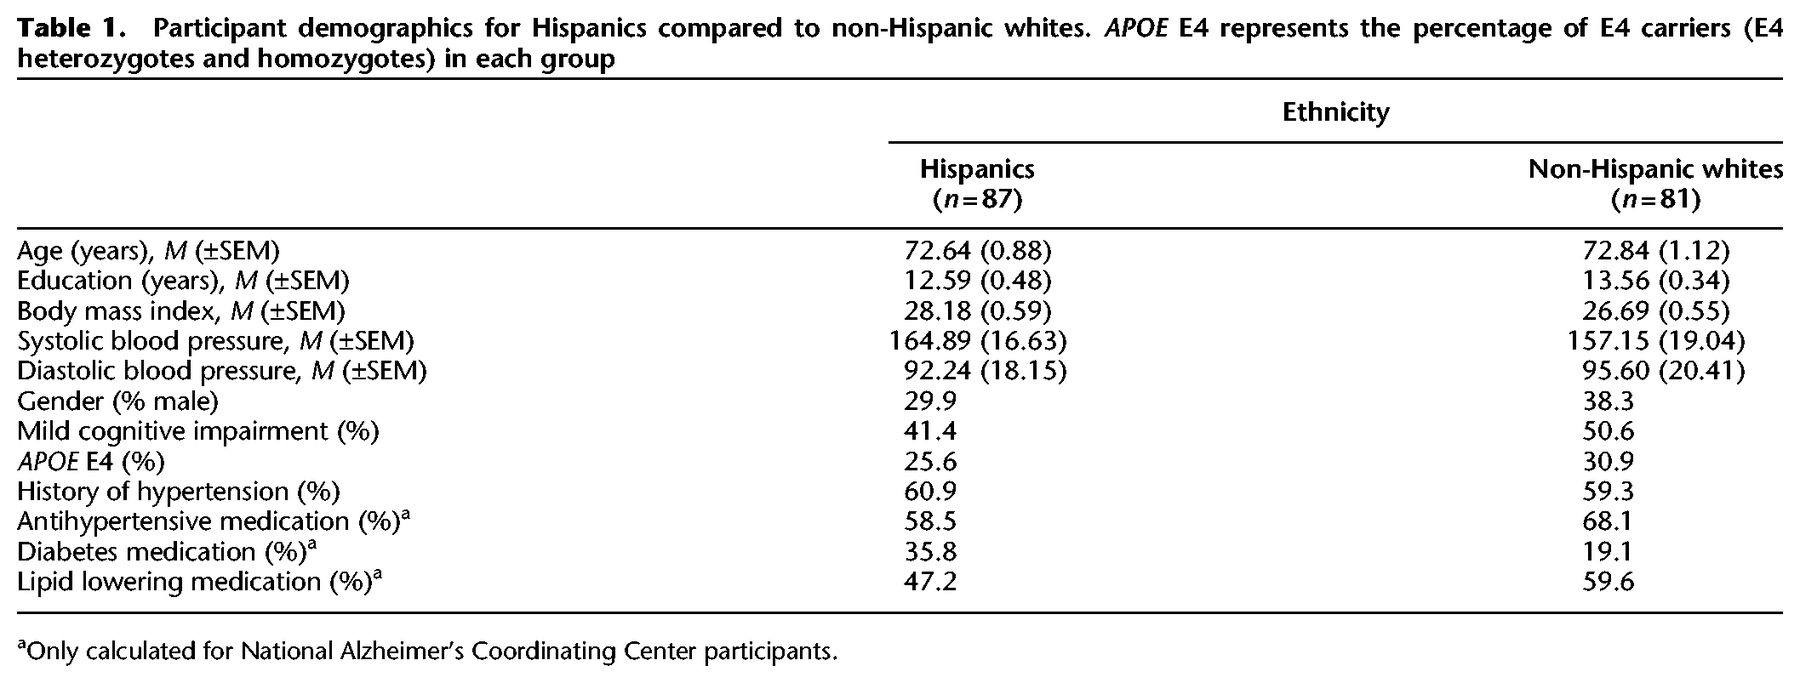
Table 1.
Participant demographics for Hispanics compared to non-Hispanic whites. APOE E4 represents the percentage of E4 carriers (E4 heterozygotes and homozygotes) in each group
Click on table to view larger version.