


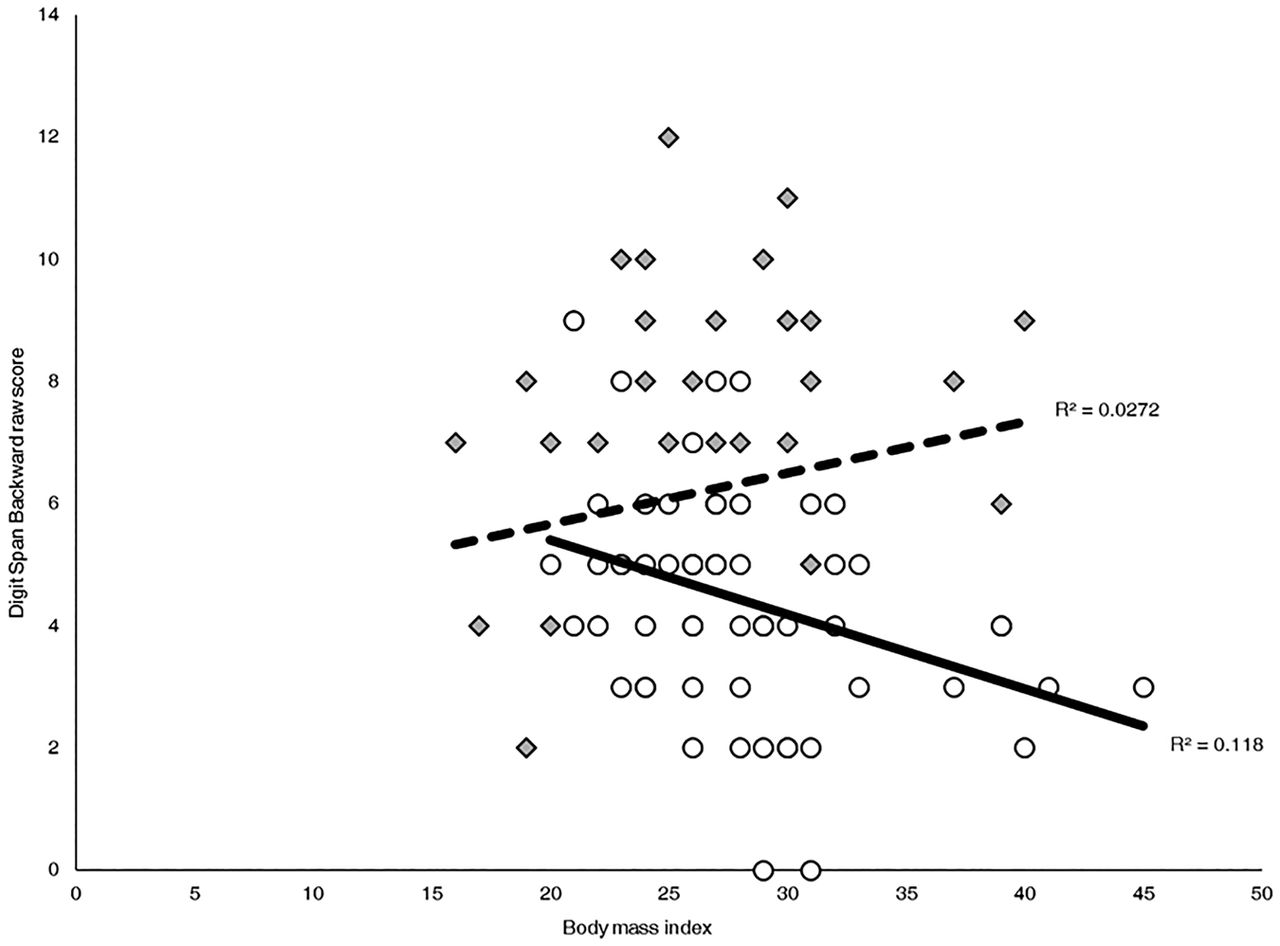
Figure 2.
Pearson correlations and percent variance explained (R2) between Digit Span Backward raw scores and BMI per ethnic group. Among Hispanics, higher BMI was associated with lower Digit Span Backward scores, (r(60) = −0.34, P < 0.01). BMI was not associated with scores among non-Hispanic whites (r(62) = .17, n.s.). Hispanics are represented by open dots and a solid line. Non-Hispanic whites are represented by shaded diamonds and a dashed line.



