


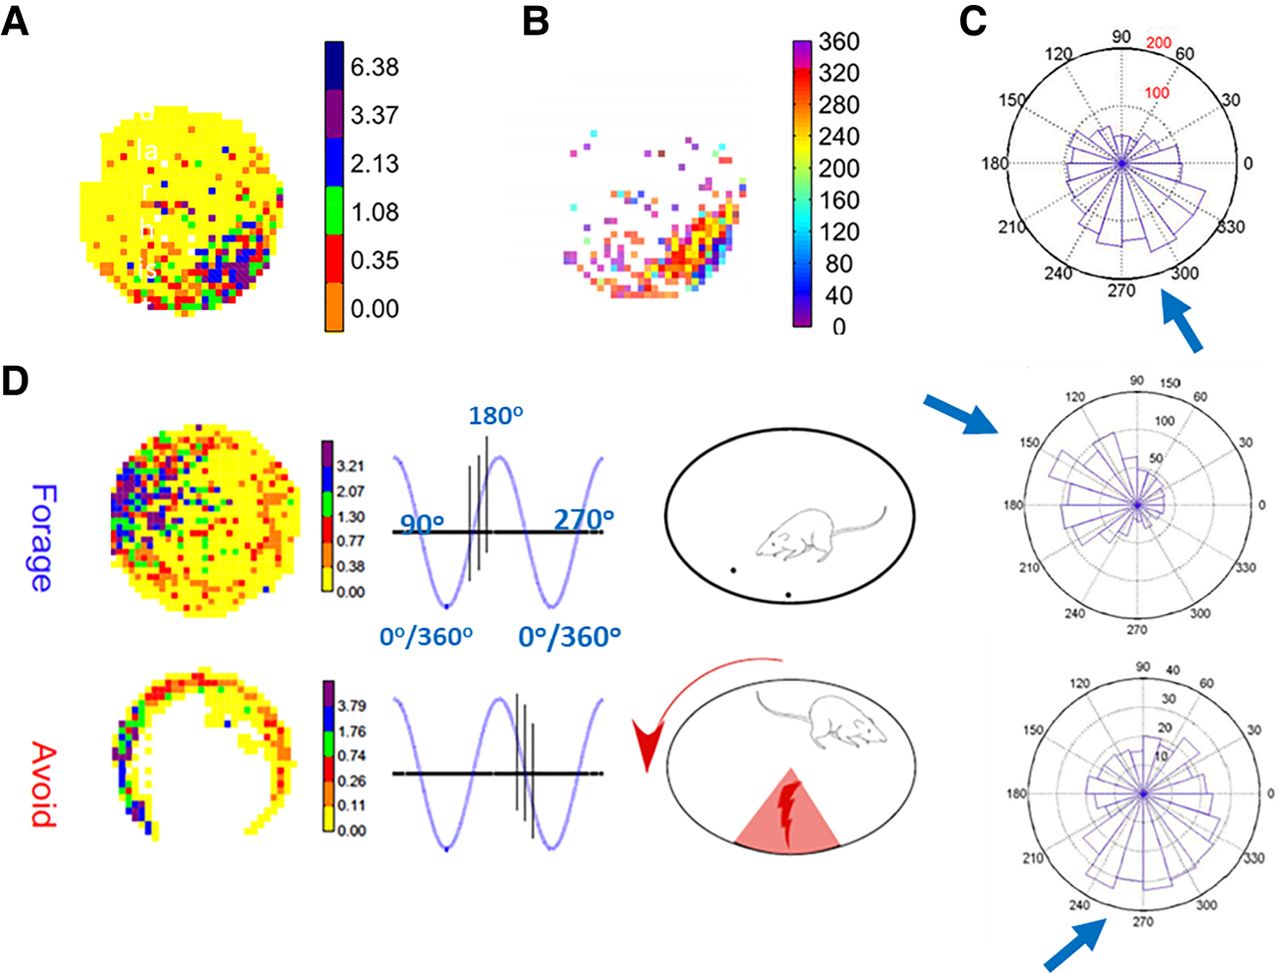
Place cell AP phase preference with regard to local θ. (A) AP firing rate map with median firing rate per pixel for a single place cell. (B) Phase map indicating the median phase of θ for APs in each pixel. (C) Rose plot circular histogram indicating the place cell's preferred firing phase with θ. The phase map in B indicates that the APs tend to fire earlier in the θ cycle as the animal moves through the firing field. The higher firing rates correspond to phases between 240°–320° (arrow), consistent with the rose plot in C. (D) Shift in preferred phase of firing of a hippocampal place cell within the θ cycle between foraging and avoidance contexts. During foraging the cell fired in the ascending phase of θ. During active avoidance session the cell shifted firing to the descending phase of θ. Rose plot histogram demonstrates a shift of phase preference from ∼150° in foraging to ∼240°–270° in active avoidance (arrows).



