


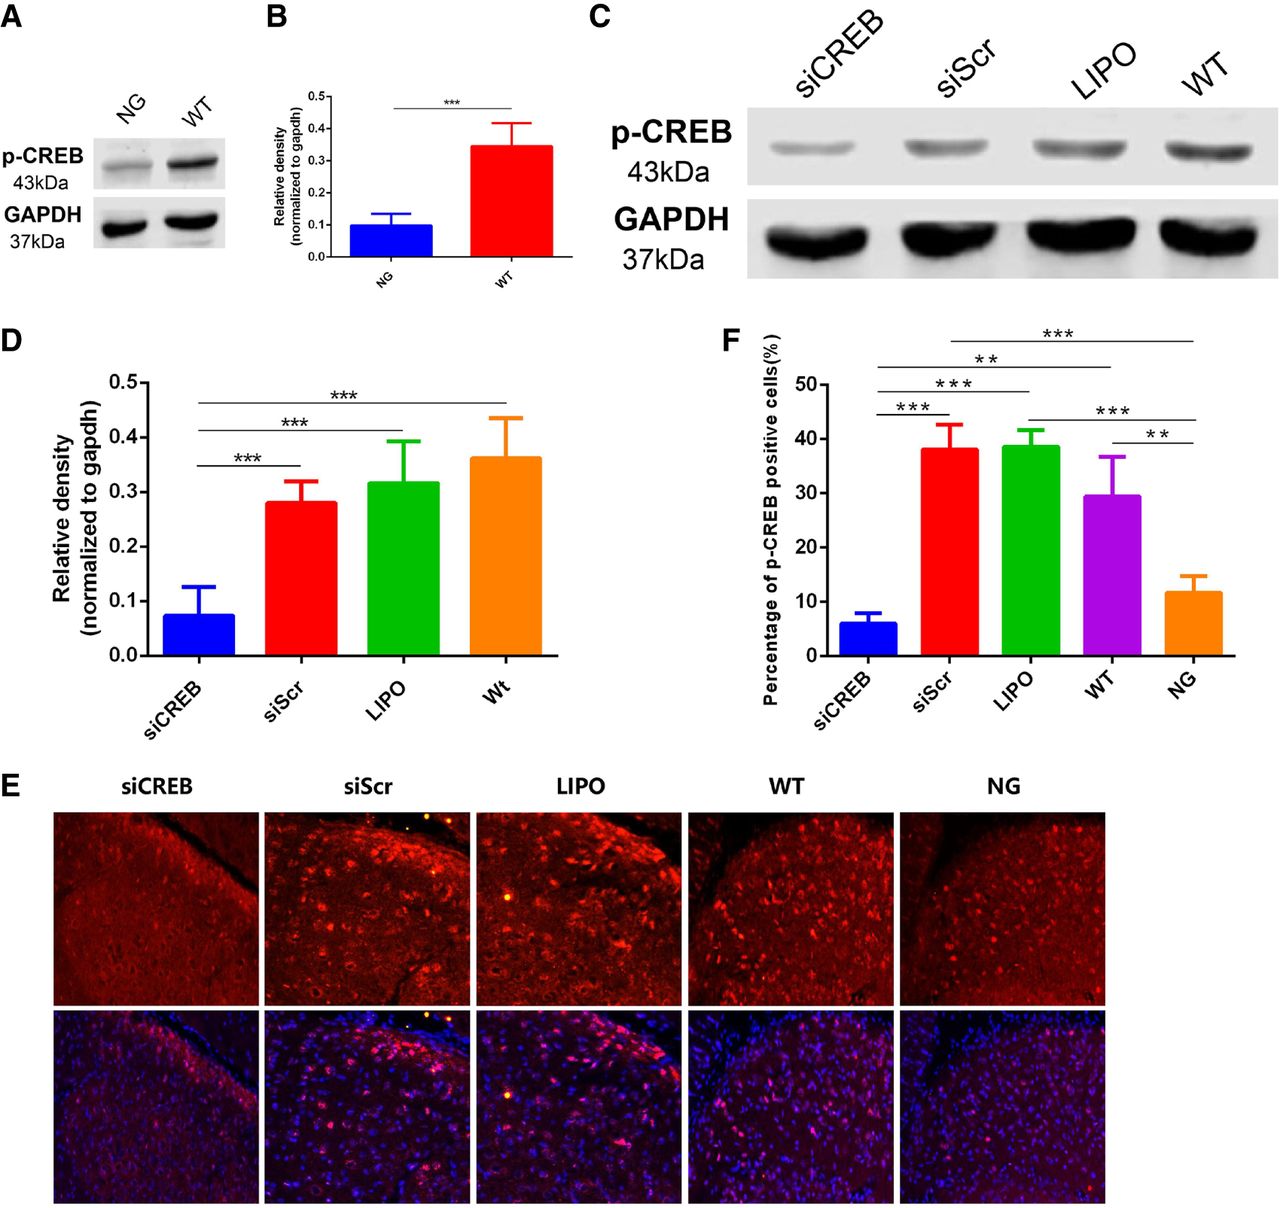
(A–D) Western blot representative images and statistic analysis of protein level of p-CREB. (E) Immunofluorescence representative images. Images of WT and NG were collected from ventrolateral subregion of the LD (LDVL) in the left hemispheres, and images of siCREB, siScr, and LIPO groups were collected from LDVL in the right hemisphere. Positive p-CREB cells were expressed in the nucleus, presenting approximately pink after merging with DAPI staining. (D) The percentage of positive p-CREB cells of the total number of cells, quantified and analyzed by Image Pro Plus 7.0 (Media Cybernetics, Inc.). Error bars represent SD and significant differences are indicated by (*) P < 0.05, (**) P < 0.01, (***) P < 0.001. N = 5–6 rats in each group.



