


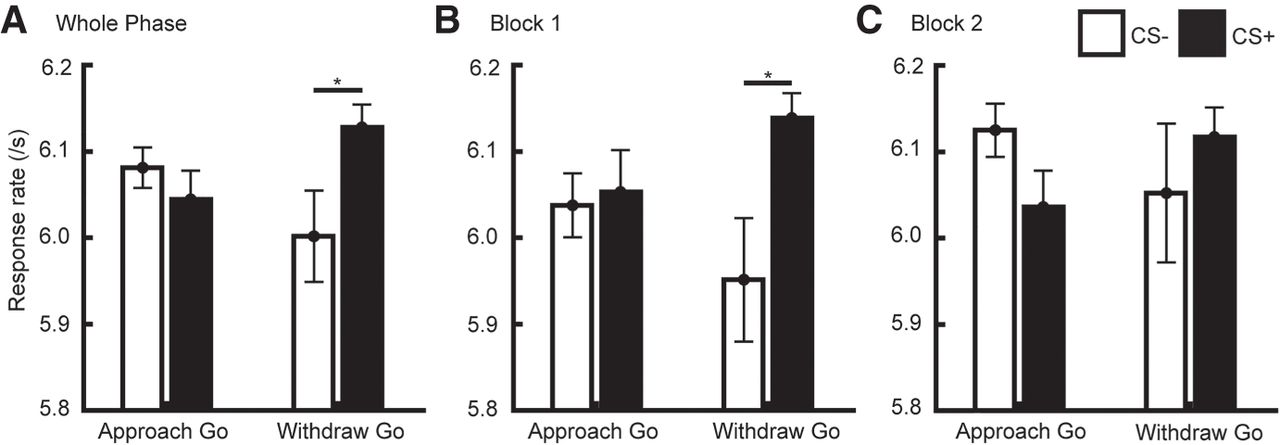
Figure 3.
Response rate of Go trials in transfer phase in Experiment 2. (A) Response rate for both blocks, i.e., the whole transfer phase. CS valences discriminated response rate in Withdraw-Go trials only. (B) Response rate in block 1. (C) Response rate in block 2. Data are shown as mean ± SEM. (* in A) P < 0.05 in a priori t-test; (* in B) P < 0.05 in follow-up paired t-test for each block separately, after Bonferroni-correction for two tests.



