


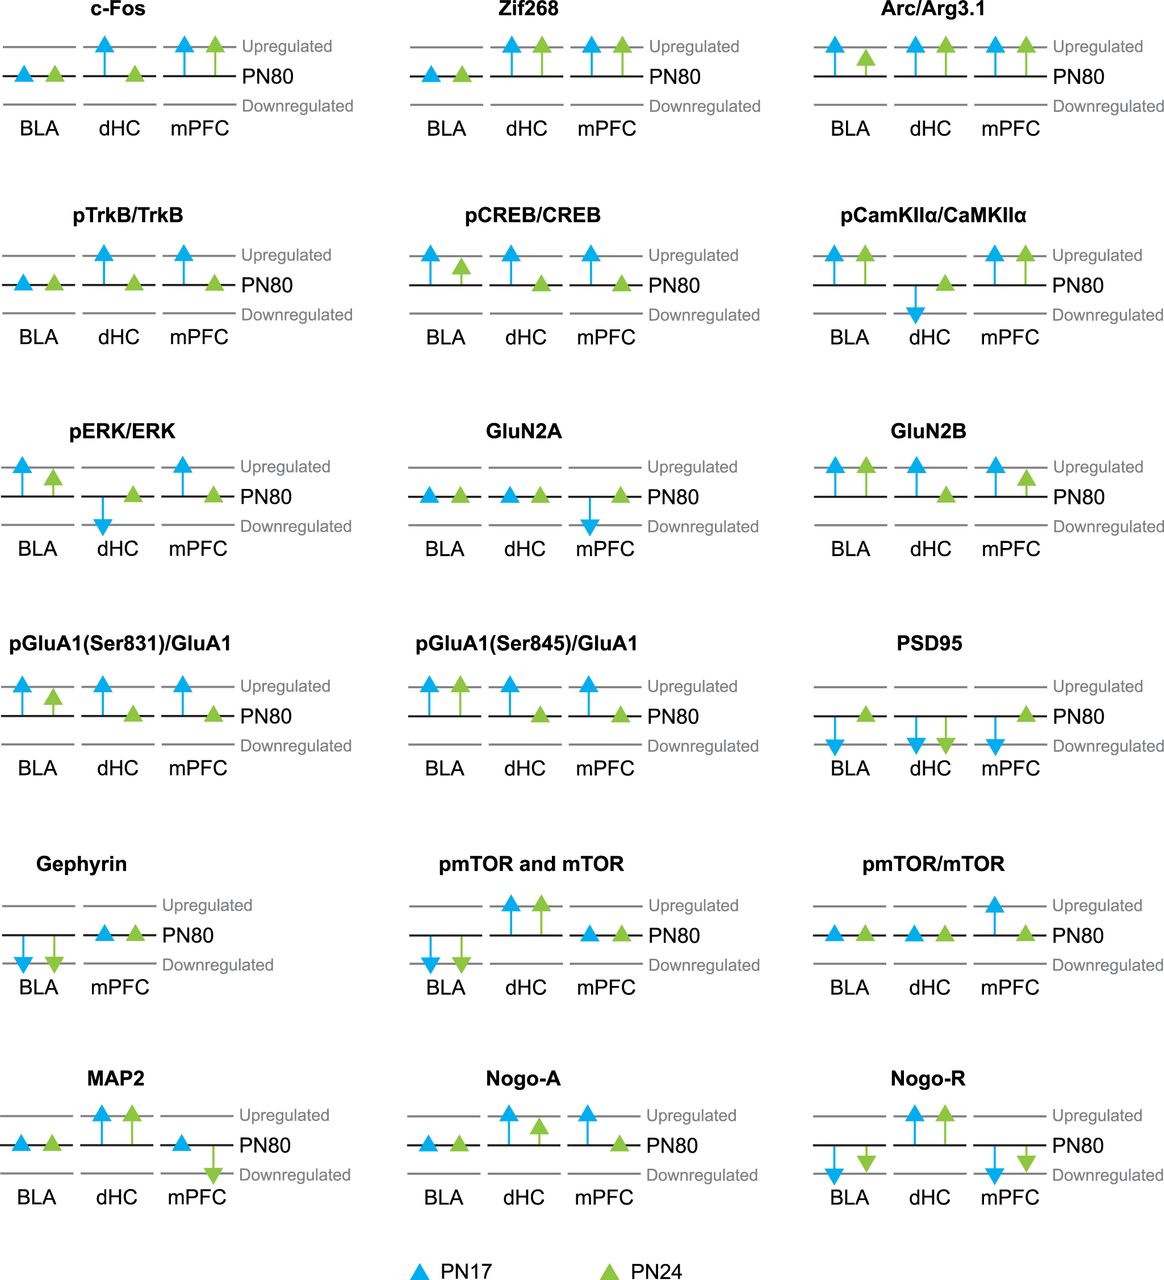
Graphic representation depicting increases or decreases of protein levels at PN17 and PN24 relative to PN80 in the rat BLA, dHC (Travaglia et al. 2016a,b), and mPFC (Jia et al. 2018). The black lines denote the level of each marker at PN80, which was used as a relative reference. Blue and green triangles depict PN17 and PN24 markers, respectively. A triangle placed on the PN80 black line indicates no significant change compared with PN80 and the directions of the arrows indicate significant up-regulation or down-regulation of the protein levels. Only markers that exhibit differential progression over ages in the different regions are shown.



