


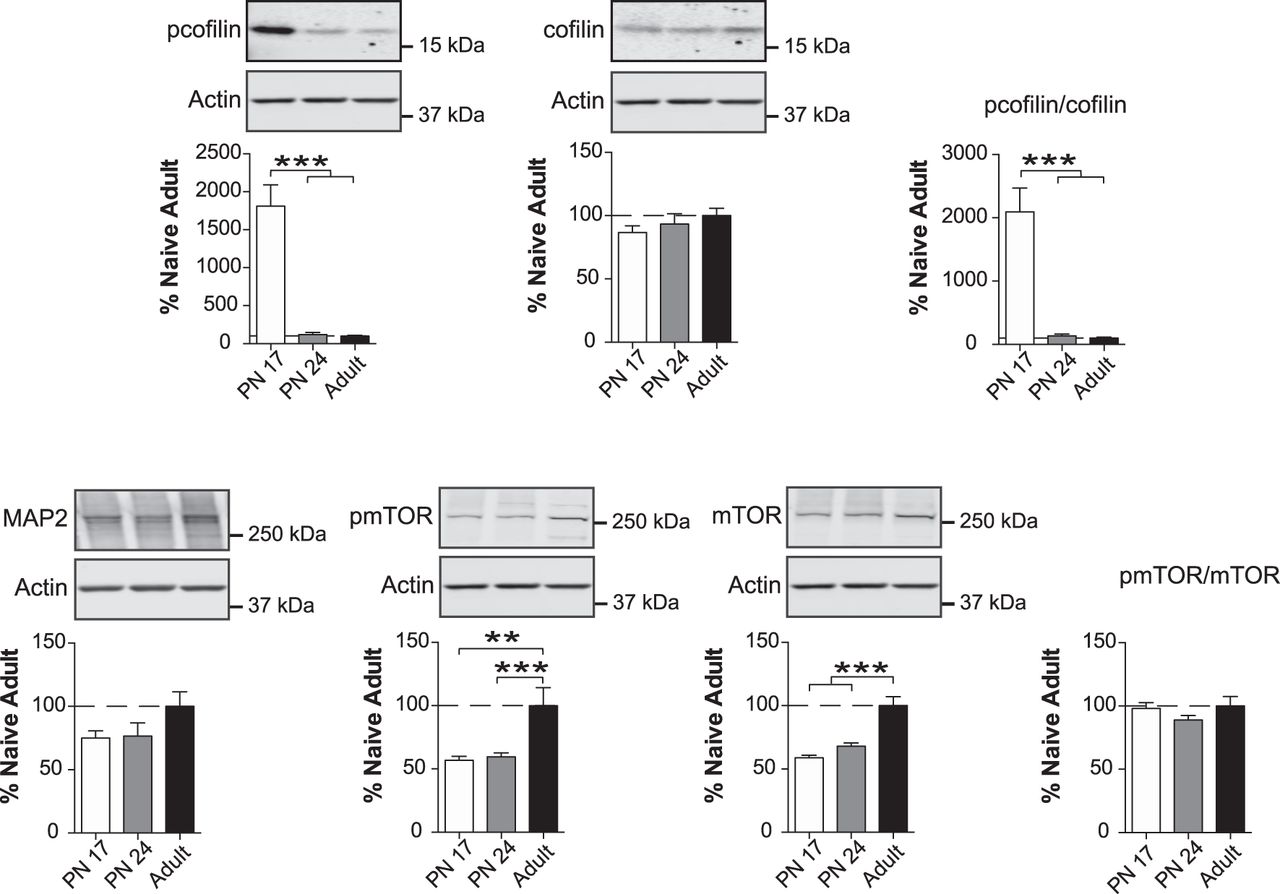
Figure 7.
Neurite connectivity markers change over the course of development. Densitometric western blot analyses were performed on total protein extracts of BLA from rats euthanized at PN17 (white, n = 5–6), PN24 (gray, n = 7) or PN80 (adult; black, n = 4–6). Data are expressed as mean percentage ± SEM of adult rat levels. One-way ANOVA followed by Newman–Keuls post-hoc tests: (**) P < 0.01; (***) P < 0.001.



