


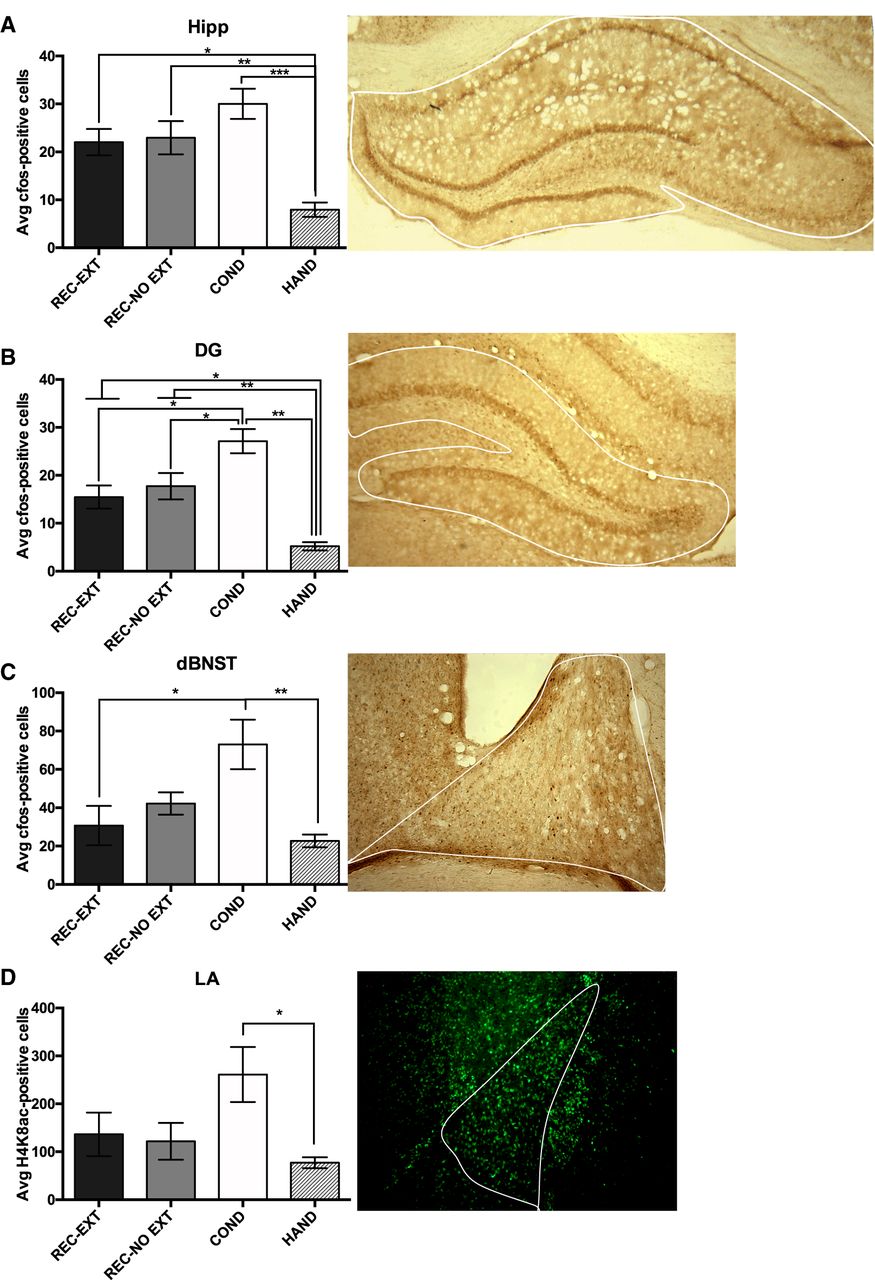
Acquisition leads to stronger activity marker expression than rapid reacquisition. (A) The bar graph on the left shows the average c-Fos-positive cells within the entire dorsal hippocampus for each group. The image on the right shows a representative coronal slice of the hippocampus and the solid white line shows the region that was assessed for creating the average c-Fos-positive cell counts for analysis. (B) A similar figure for the DG of the hippocampus. (C) A similar figure for the adBNST. (D) The bar graph on the left shows the average H4K8ac-positive cells within the lateral amygdala (LA) for each group. The panel on the right shows a representative coronal slice of the LA and the solid white line shows the region that was assessed for creating the average H4K8ac-positive cells. Significance between groups is represented by (***) < 0.001; (**) P < 0.01; (*) P < 0.05. Group numbers for each region are detailed in Tables 1, 2. Error bars represent standard error of the mean.



