


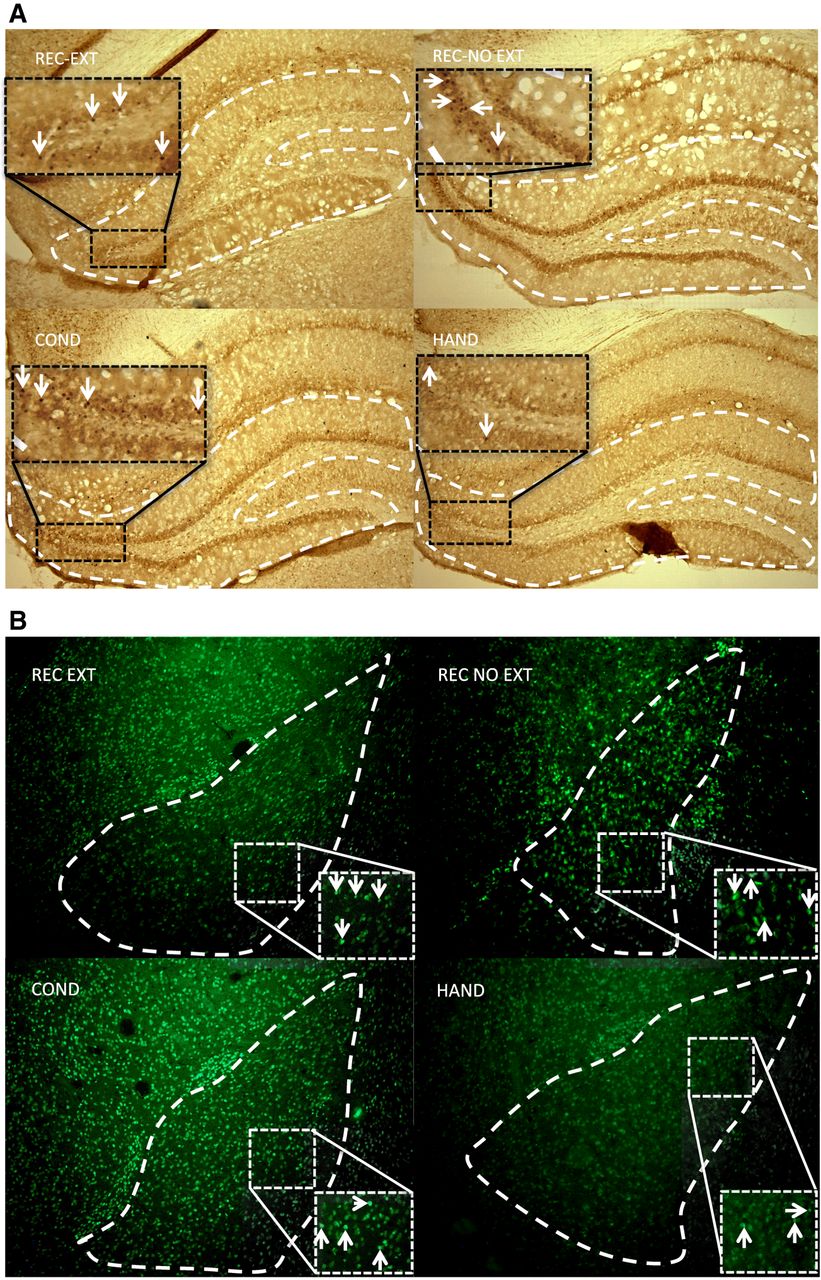
Representative coronal slices of c-Fos and H4K8ac staining. (A) The four panels are representative images of average c-Fos staining in DG for each group that resulted from DAB IHC. The large-dashed white line represents what region was counted for the DG. The small-dashed black square shows a magnified region of the slices with white arrows indicating cells showing positive DAB staining (not all stained cells are indicated with an arrow to maintain clarity). (B) The four panels are representative images of average H4K8ac staining in LA for each group that resulted from fluorescent IHC. The large-dashed white line represents what region was counted for the LA. The small-dashed white square shows a magnified region of the slices with white arrows indicating cells showing positive fluorescent staining (not all stained cells are indicated with an arrow to maintain clarity).



