


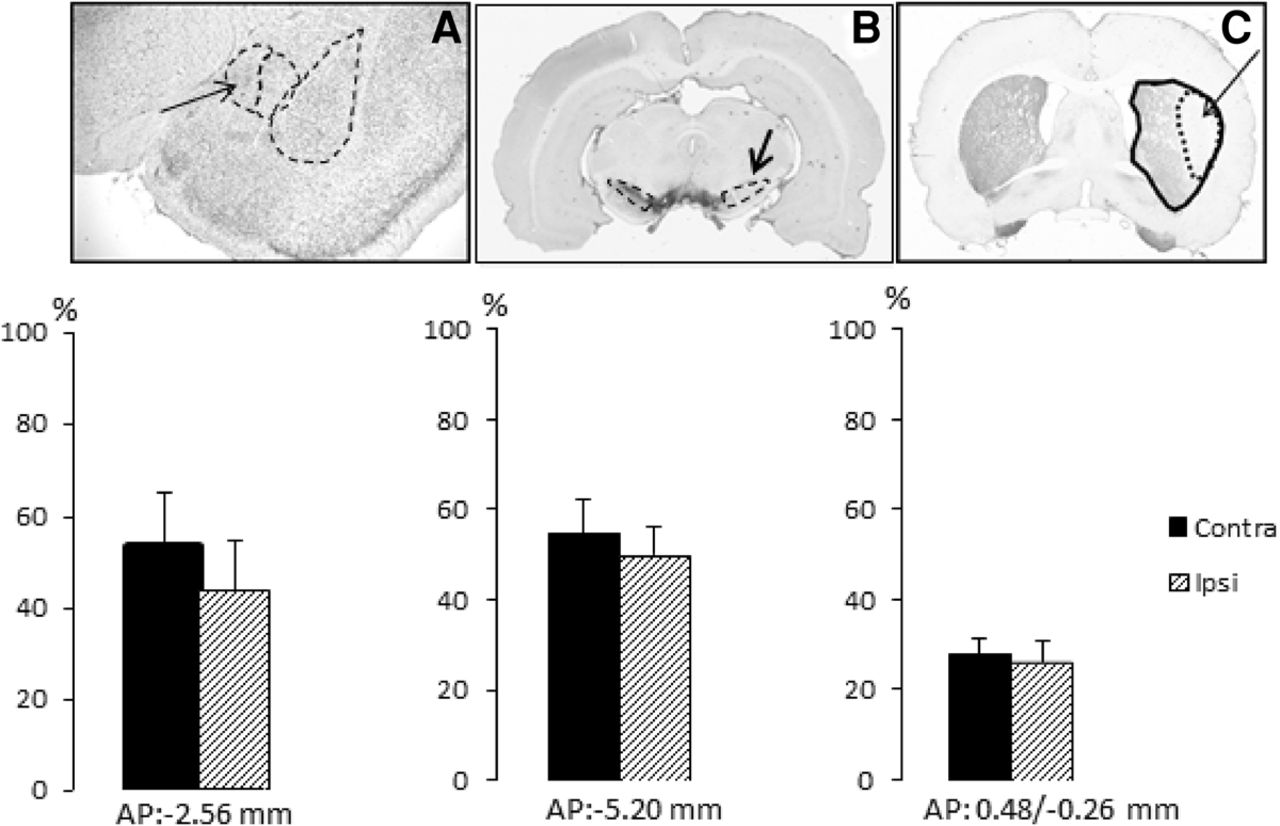
The photographs illustrate Nissl in the CeA (A), and TH immunoreactivity in the SNc (B) and in the lateral striatum (C), as described in Faure et al. (2005). Lesions were evaluated qualitatively for inclusion/exclusion purposes throughout the A-P extent of the lesion. Quantitative analyses are shown at only the planes shown, as a 50% lesion at the given anteroposterior level is likely to have involved the entire structure. The histograms represent the average percentage of the lesion area of CE, SNc, and DS at anterior–posterior (AP) levels relative to Bregma (Paxinos and Watson 1986) for the Ipsi (striped) and Contra (black) groups. Data are expressed as means + SEM.



