


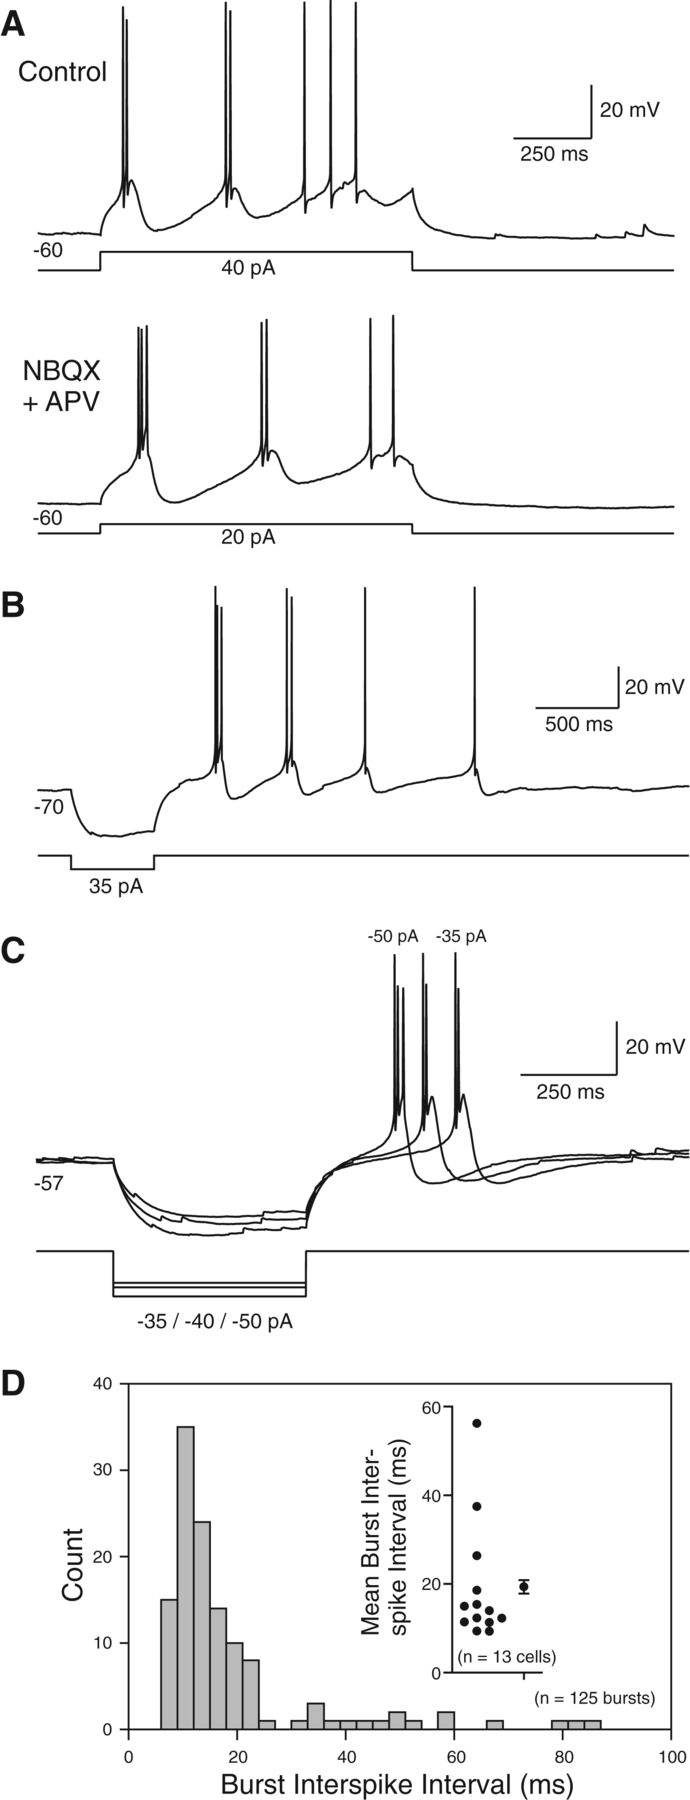
Figure 4.
Properties of Golgi cell burst responses. (A) Responses to depolarizing current steps before and after bath application of ionotropic glutamatergic receptor antagonists NBQX (5 µM) and d-APV (25 µM). (B) Example of repetitive burst responses triggered by a single hyperpolarizing current step. (C) All-or-none burst rebound responses triggered by graded hyperpolarizing current steps. (D) Histogram of inter-spike intervals within all-or-none bursts from 13 Golgi cells. (Inset) Distribution of burst inter-spike intervals in each Golgi cell analyzed. Overall mean ± SEM plotted to the right of the scatter plot.



