


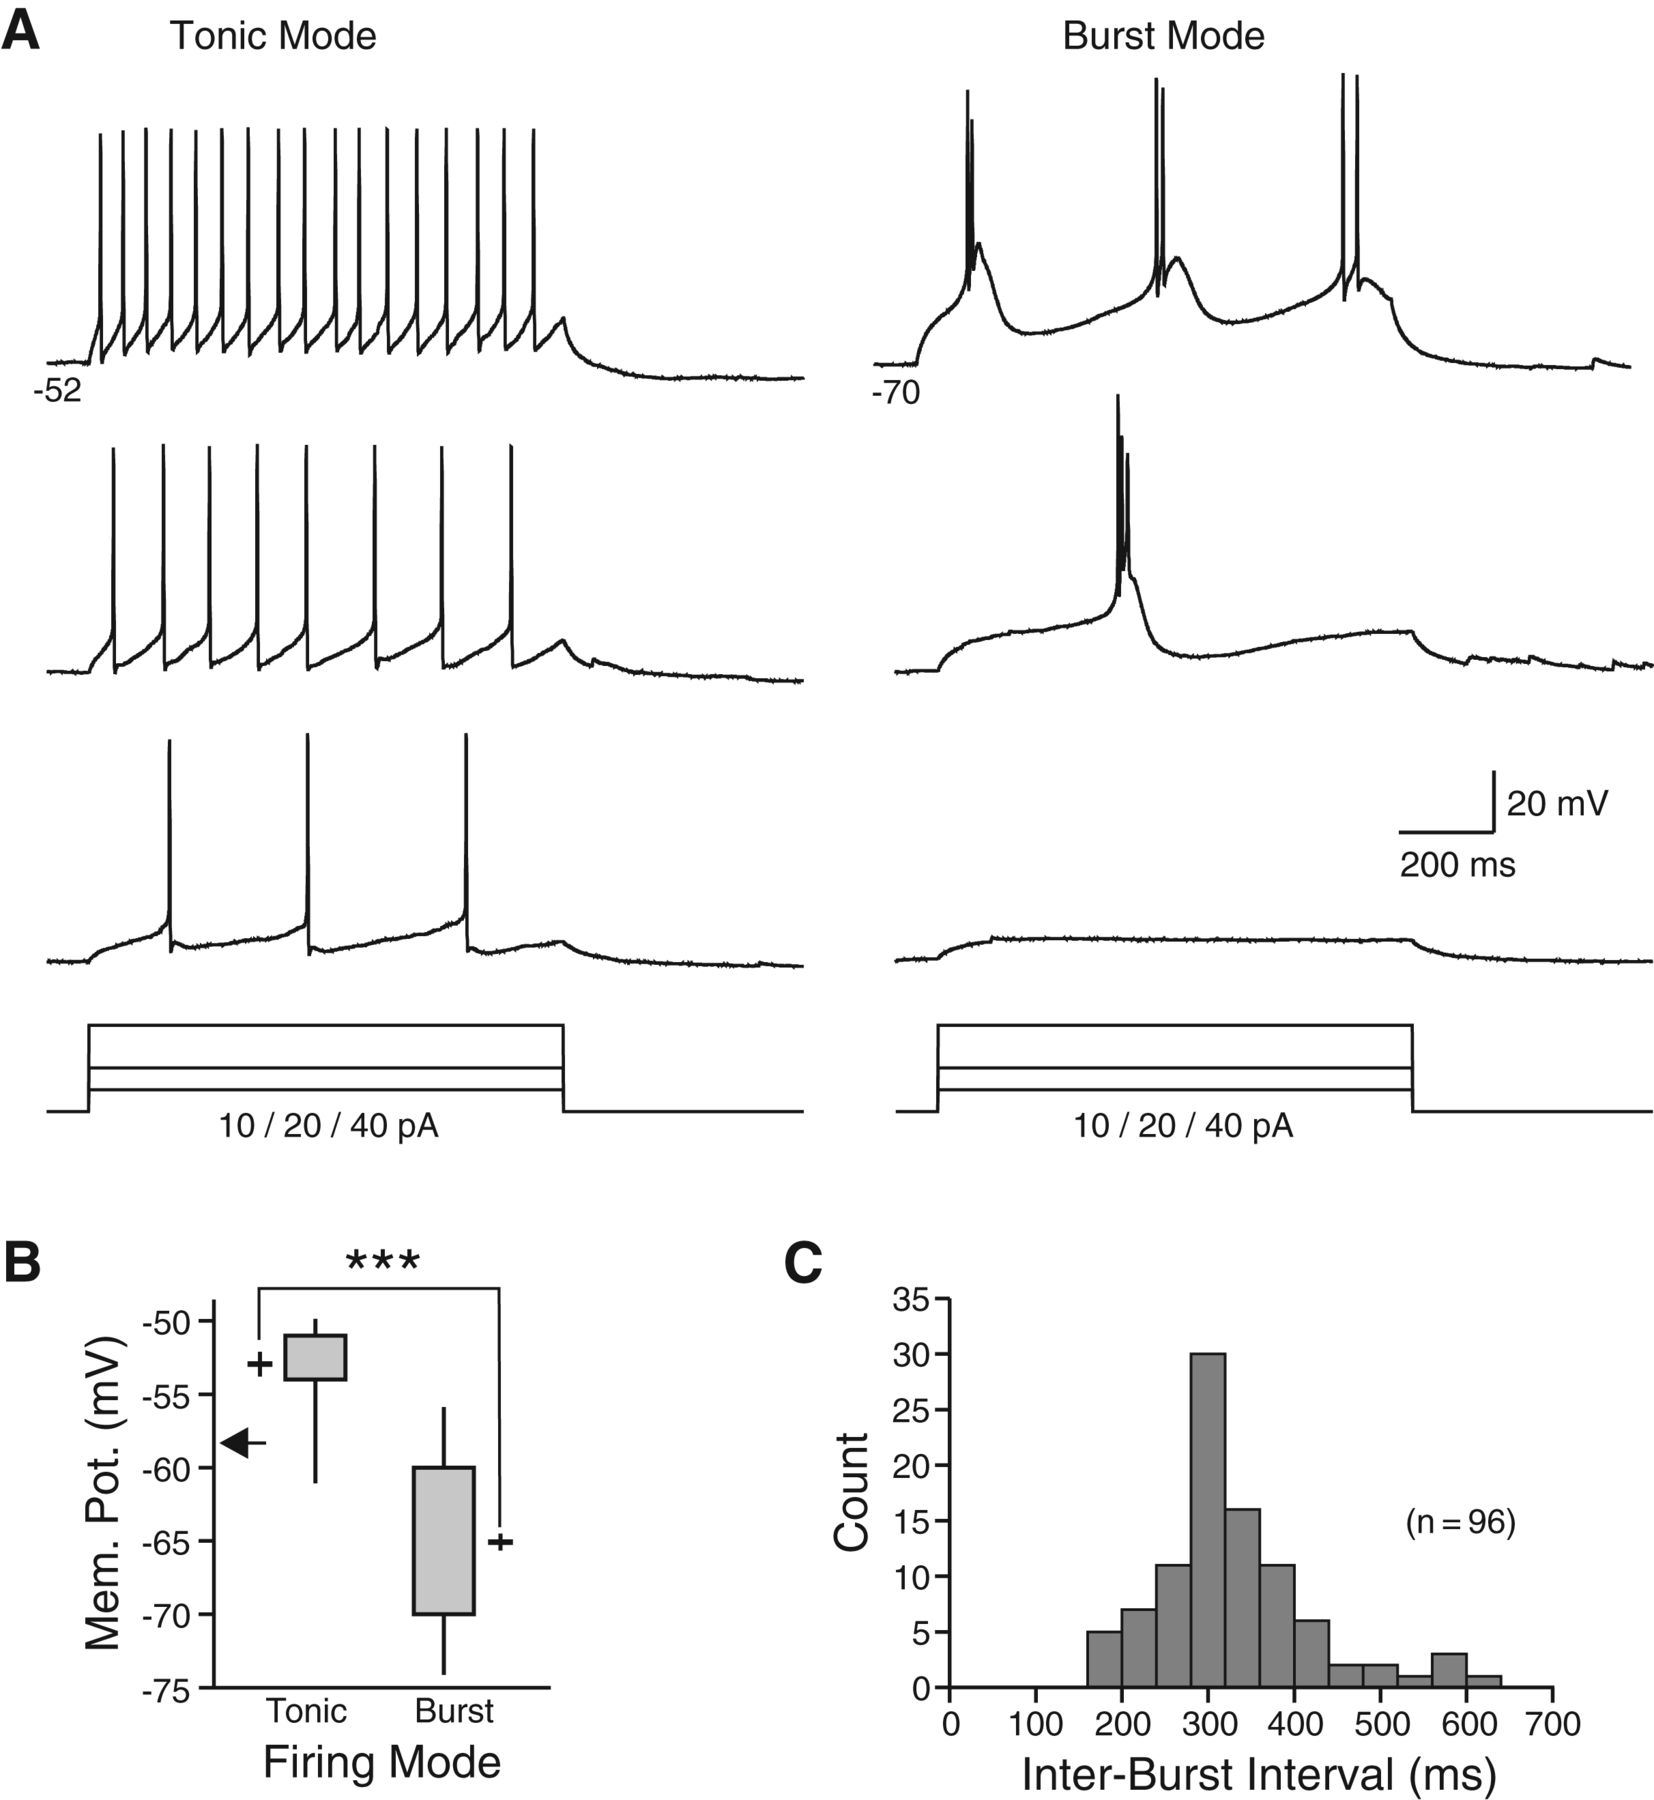
Voltage-dependent burst responses in Golgi cells. (A) Responses to the same series of graded depolarizing current steps at two different membrane potentials in one Golgi cell. (B) Plot of firing mode (bursting or tonic firing) associated with different membrane potentials in recordings from 13 Golgi cells. Vertical lines indicate range over all membrane potentials, and filled rectangles represent 95% confidence intervals of the mean. The membrane potential mean ± SEM for each firing mode over 13 Golgi cells is plotted outside filled rectangles. The average resting potential of Golgi cells without added bias current is indicated by horizontal arrow inside Y axis. (***) P < 0.0001. (C) Histogram of intervals between bursts in trials in which depolarizing current steps triggered more than one burst response.



