


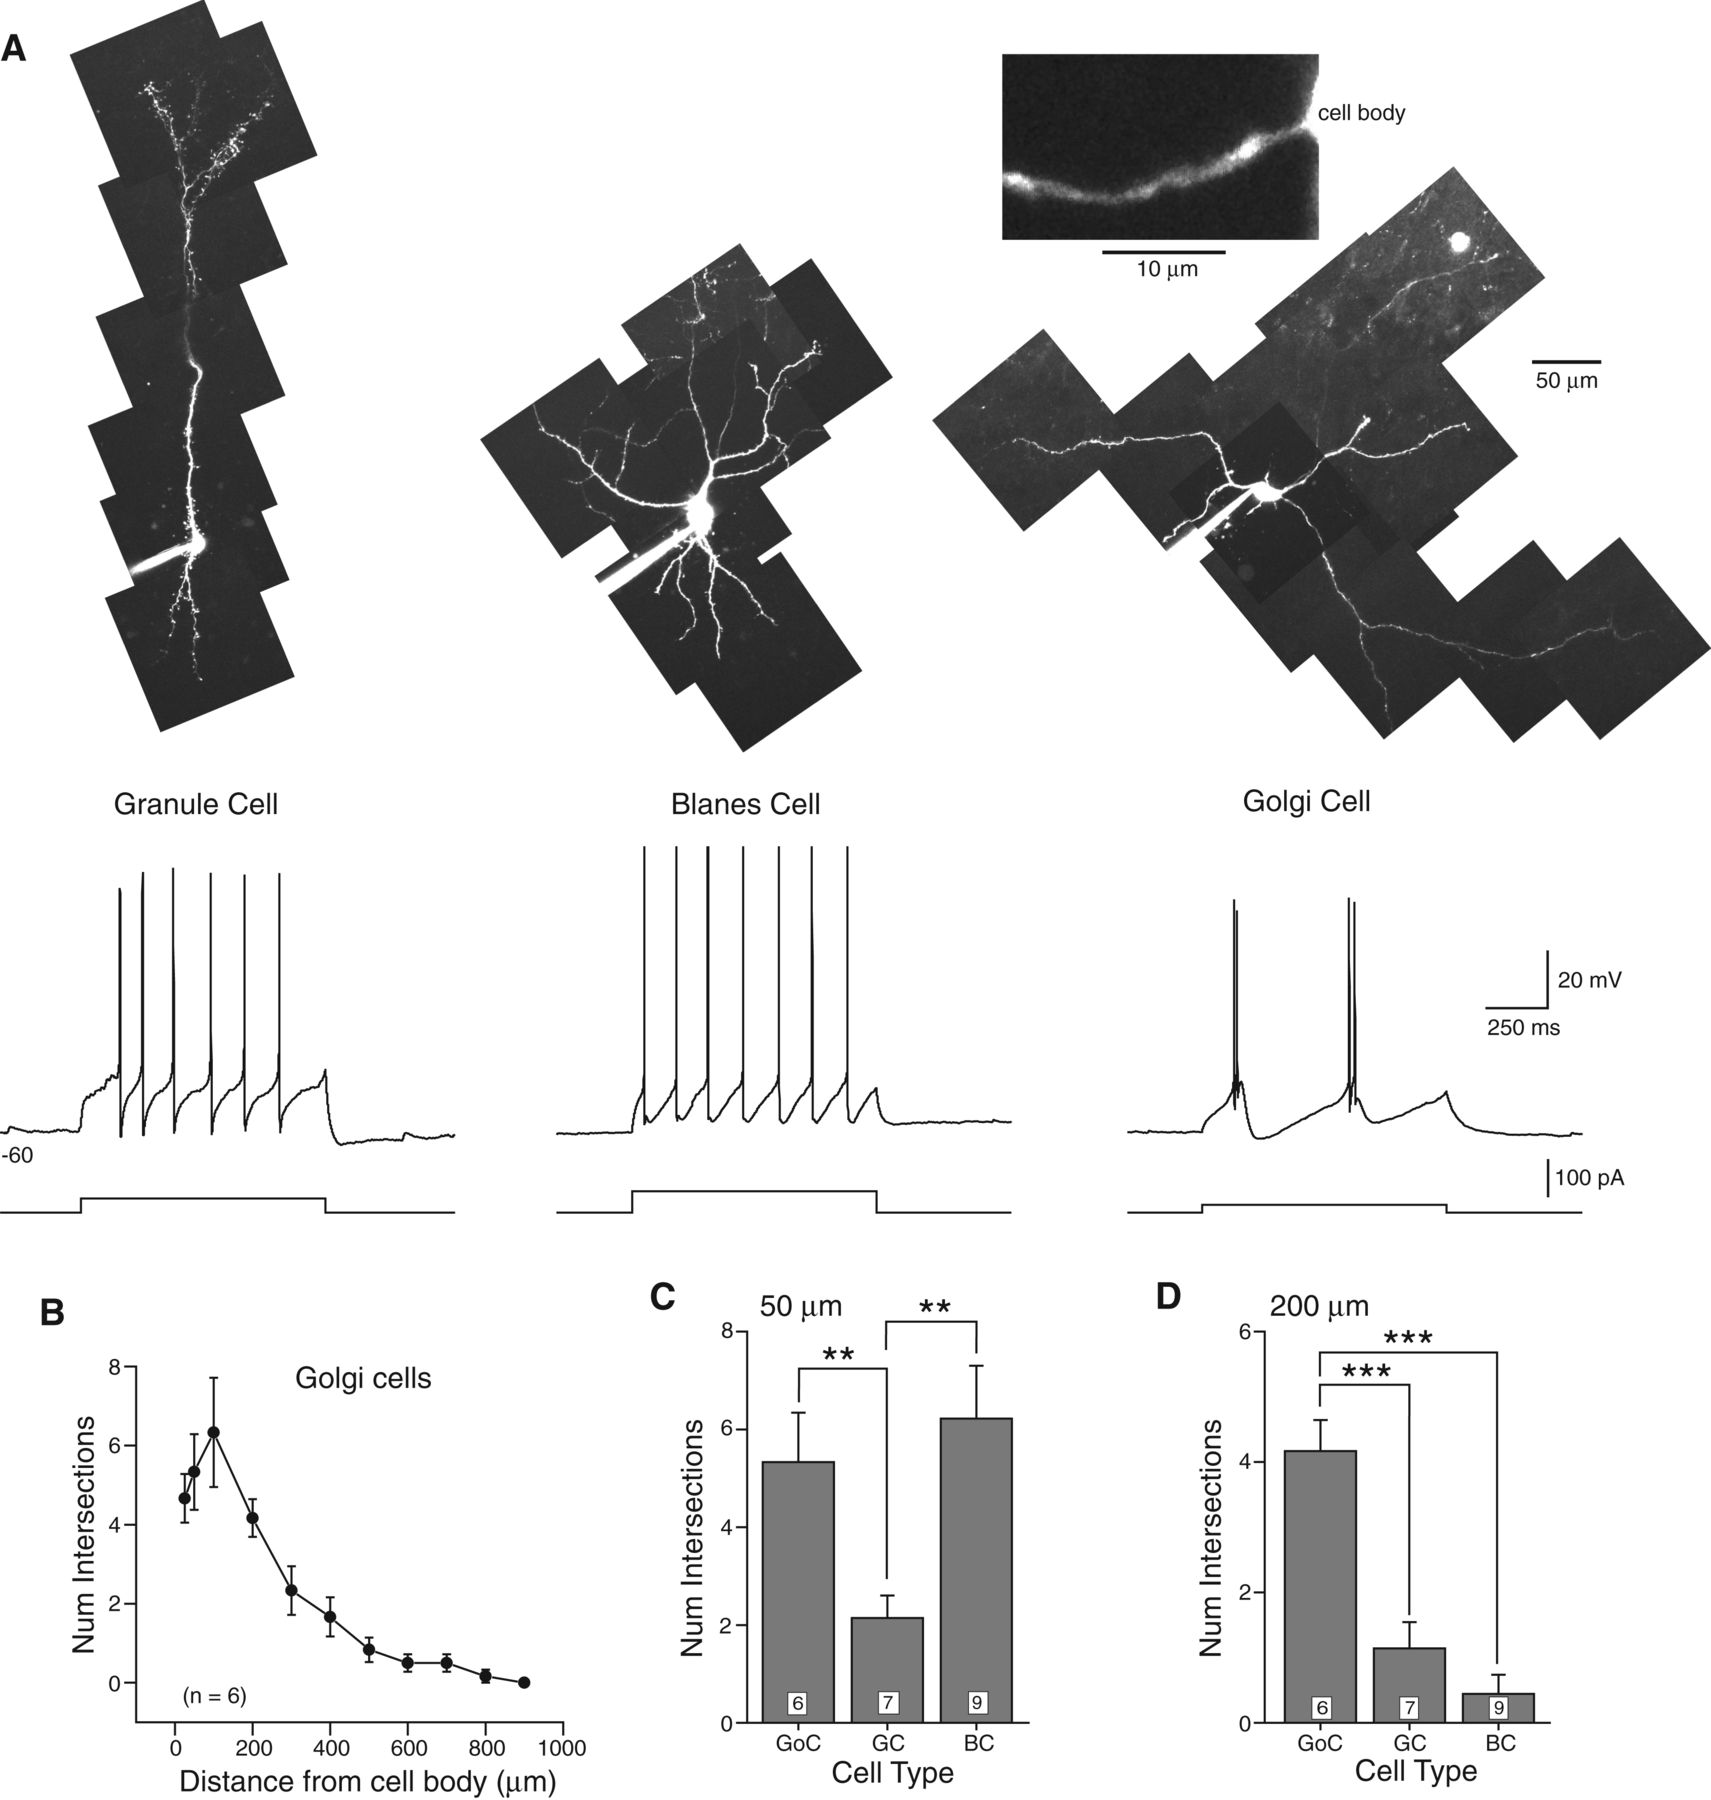
Morphology and intrinsic properties of neurons in the granule cell layer. (A) Reconstructions of three different GCL neurons recorded intracellularly and filled with Alexa594. Neurons were imaged in live brain slices using 2-photon microscopy. Image montages were created from multiple maximal Z-stack projections. Calibration bar represents 50 µm in each montage and 10 µm in the enlargement of the Golgi cell dendrite shown in the inset. Example response to 1-sec duration depolarizing steps are shown below each montage. The membrane potential at the beginning of each episode is indicated below trace. (B) Sholl analysis of dendritic arborization calculated from six Golgi cells. (C) Plot of the frequency of dendritic bifurcations from Sholl analysis 50 µm from the cell body in Golgi cells (GoC, n = 6), granule cells (GC, n = 7), and Blanes cells (BC, n = 9). (**) P < 0.02. (D) Plot of frequency of dendritic bifurcations 200 µm from the cell body in the same neuron classes. (***) P < 0.001. Granule and Blanes cell reconstructions analyzed to compare with Golgi cells were obtained as part of a previous study (Pressler and Strowbridge 2006).



