


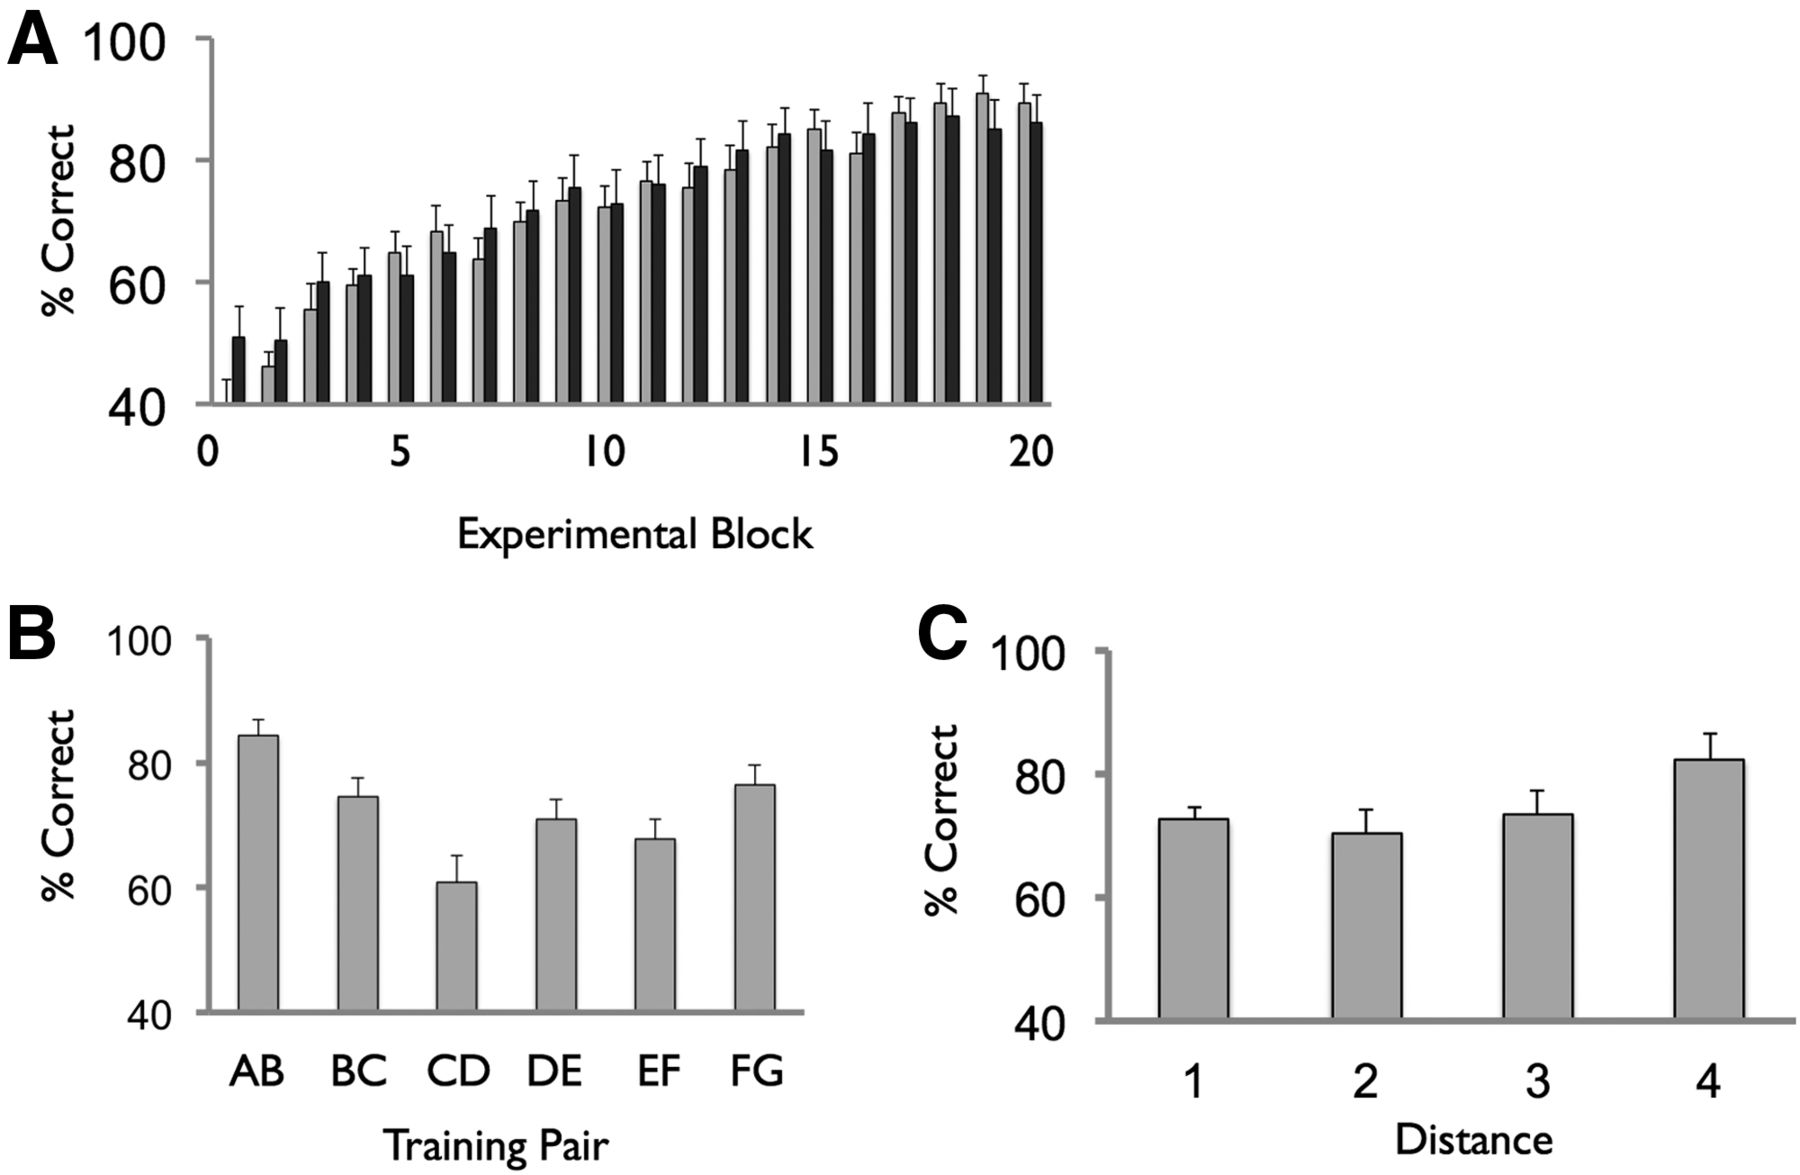
Figure 2.
Phase 1 performance. (A) Training trial (light gray) and test trial (dark gray) performance shown across the 20 blocks. (B) Training trial performance as a function of pair. (C) Test trial performance as a function of symbolic distance (e.g., a B–D test trial has a distance of two). Note that test trial blocks also included training pairs (e.g., AB), denoted by a distance of one—these are shown for completeness here, but not included in the statistical analysis of the symbolic distance effect (see Results). Data averaged across all 30 participants. Error bars reflect SEM.



