


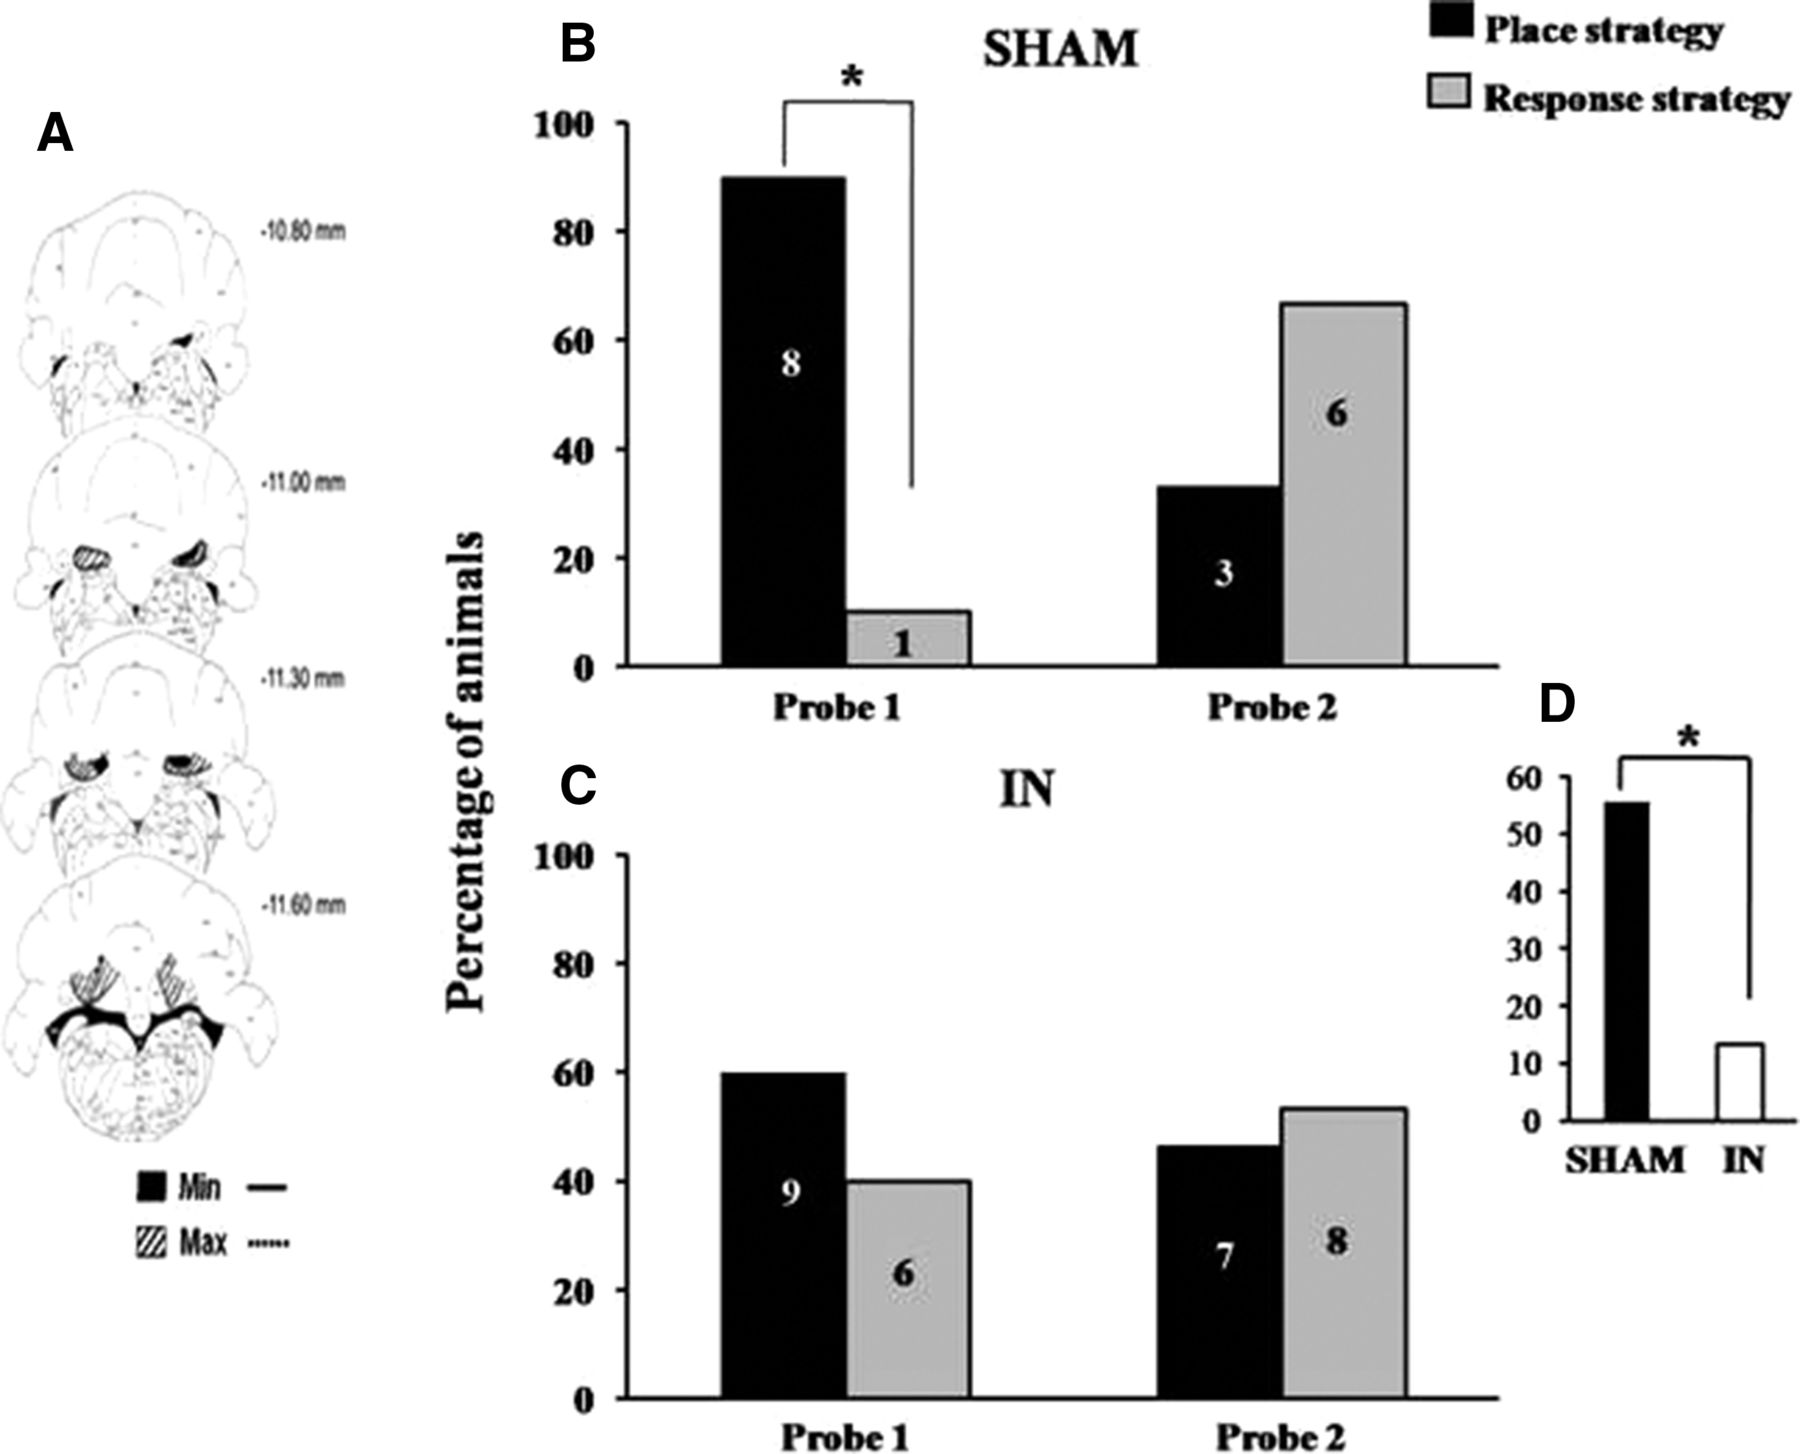
Figure 2.
(A) Diagrams of coronal sections (in reference to bregma) of the cerebellum representing the extent of cell loss observed after bilateral neurotoxic lesions. Histological reconstruction reveals the largest (max: striped parts) and smallest (min: black parts) induced damage. Percentage of Sham rats (B) and IN-lesioned rats (C) exhibiting a place or response strategy on the first and second probe tests. The number of rats showing a particular strategy is written in each column diagram. (D) Histograms represent the percentage of rats which shift from place to response strategy between the first and the second probe tests.



