


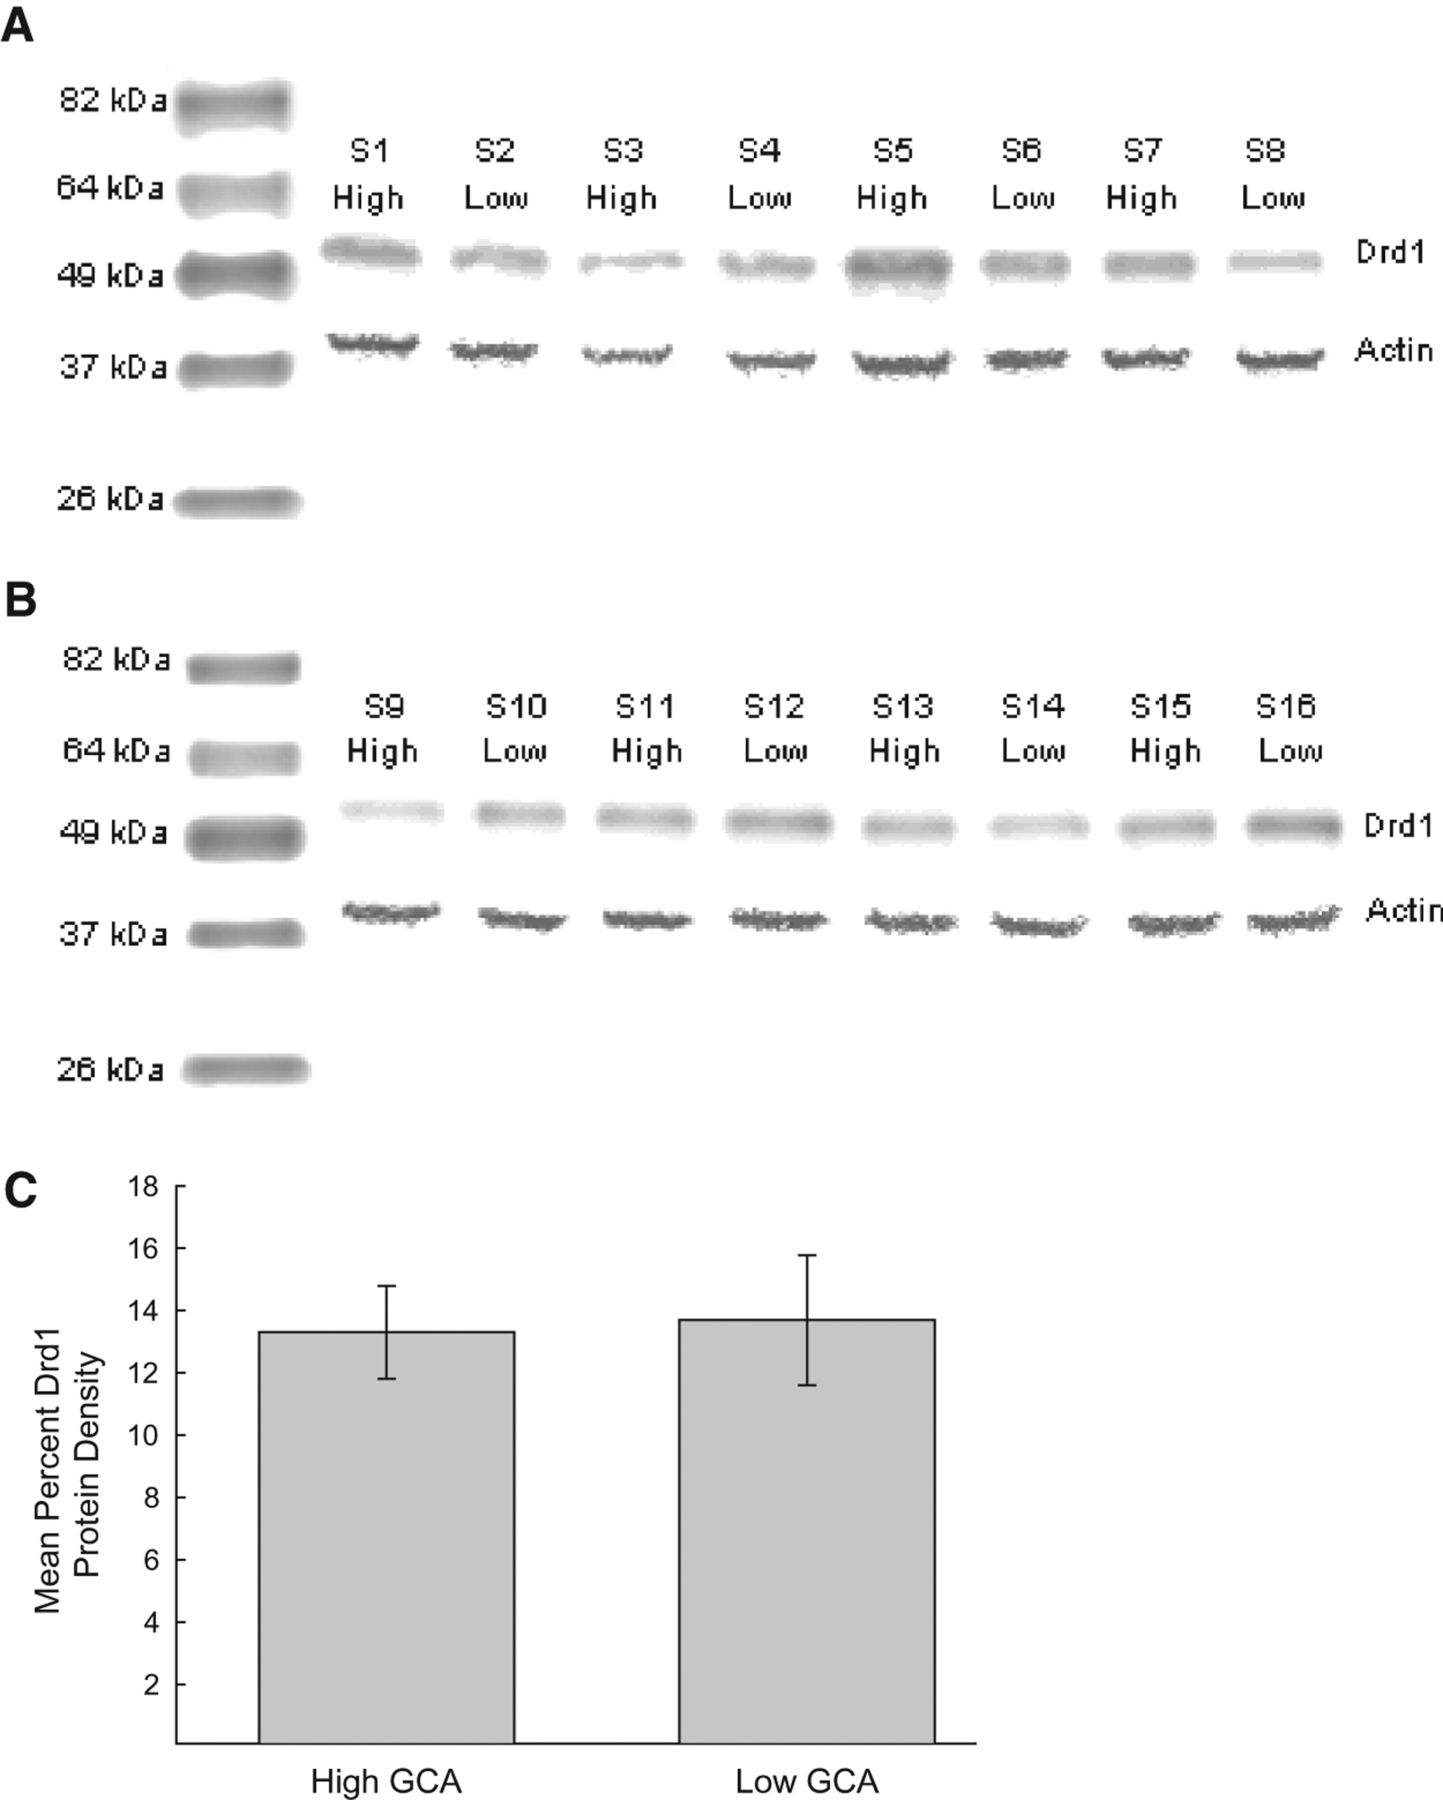
Eight animals characterized as having high GCAs and eight animals characterized as having low GCAs (taken from a total sample of 32 animals) were assayed for their levels of D1 receptor protein. Electrophoresis was performed across two gels (A,B) in which animals of high GCA and low GCA alternated between gels as well as lanes within each gel. Twenty-five micrograms of protein from high GCA animals (S1, 3, 5, 7 in A; S9, 11, 13, 15 in B) and low GCA animals (S2, 4, 6, 8 in A; S10, 12, 14, 16 in B) were loaded into each lane. Anti-Drd1 antibodies were then blotted against PVDF membranes and a single protein band was visualized at ∼52 kDA. (C) The mean ± SEM density of D1 protein from eight animals with high GCAs was compared to the mean density of eight animals with low GCAs. An independent samples t-test revealed there was no significant difference in the mean density of D1 receptor protein levels between animals of high GCA compared to those of low GCA (P > 0.05).



