


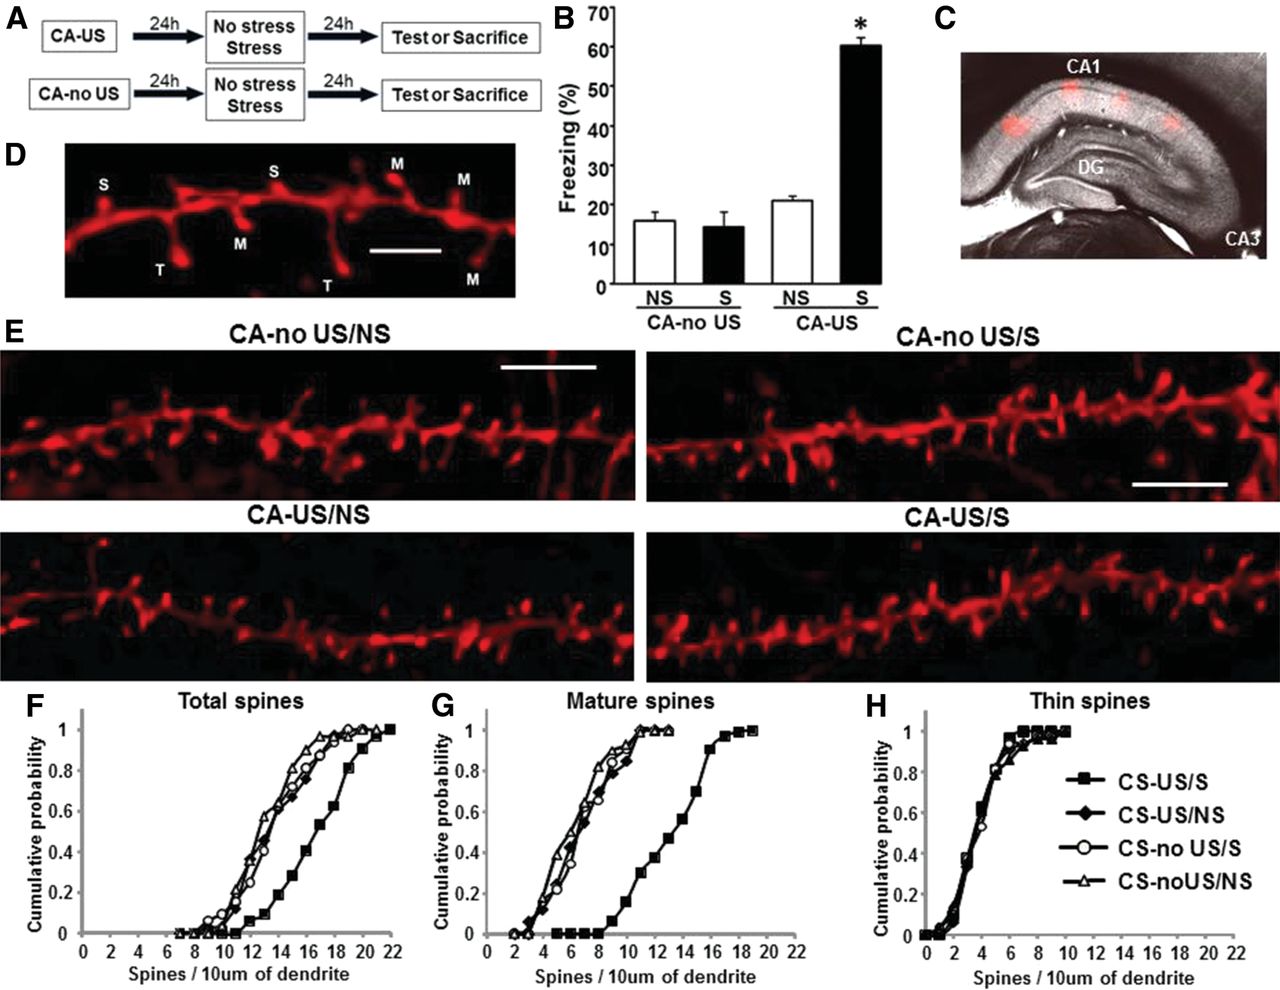
The combination between the conditioning procedure and the stress enhanced fear memory retention and generated DH structural changes. (A) Schematic representation of the experimental design. (B) Bar graph showing the freezing response denoted in animals during the test session performed 1 d after the exposure to a stressful experience. Data are expressed as mean ± SEM of the percentage of freezing spent during the test (n = 8 rats per group). (*) P < 0.05 compared to the rest of the experimental groups (two-way ANOVA, Bonferroni post-hoc test). (C) Bright field along with fluorescence image of a representative DH CA1 region acquired simultaneously in order to demonstrate the localization of the DiI labeling. (D) Representative example showing the morphology of the different types of dendritic spines observed: (M) mushroom-shaped dendritic spines, (S) stubby-shaped dendritic spines, (T) thin-shaped dendritic spines. Bar, 2 μm. (E) Representative examples of apical dendritic segments of CA1 pyramidal neurons which were selected for quantitative analysis of dendritic spines from animals: CA–noUS/NS (n = 3 rats), CA–noUS/S (n = 3), CA–US/NS (n = 3), and CA–US/S (n = 3). Bar, 3 μm. (F–H) Cumulative frequency of total (F), mature (G), and thin (H) spine density on apical dendrites of hippocampal pyramidal cells CA1 stratum radiatum (P < 0.05, by Kolmogorov–Smirnov test [KS test]).



