


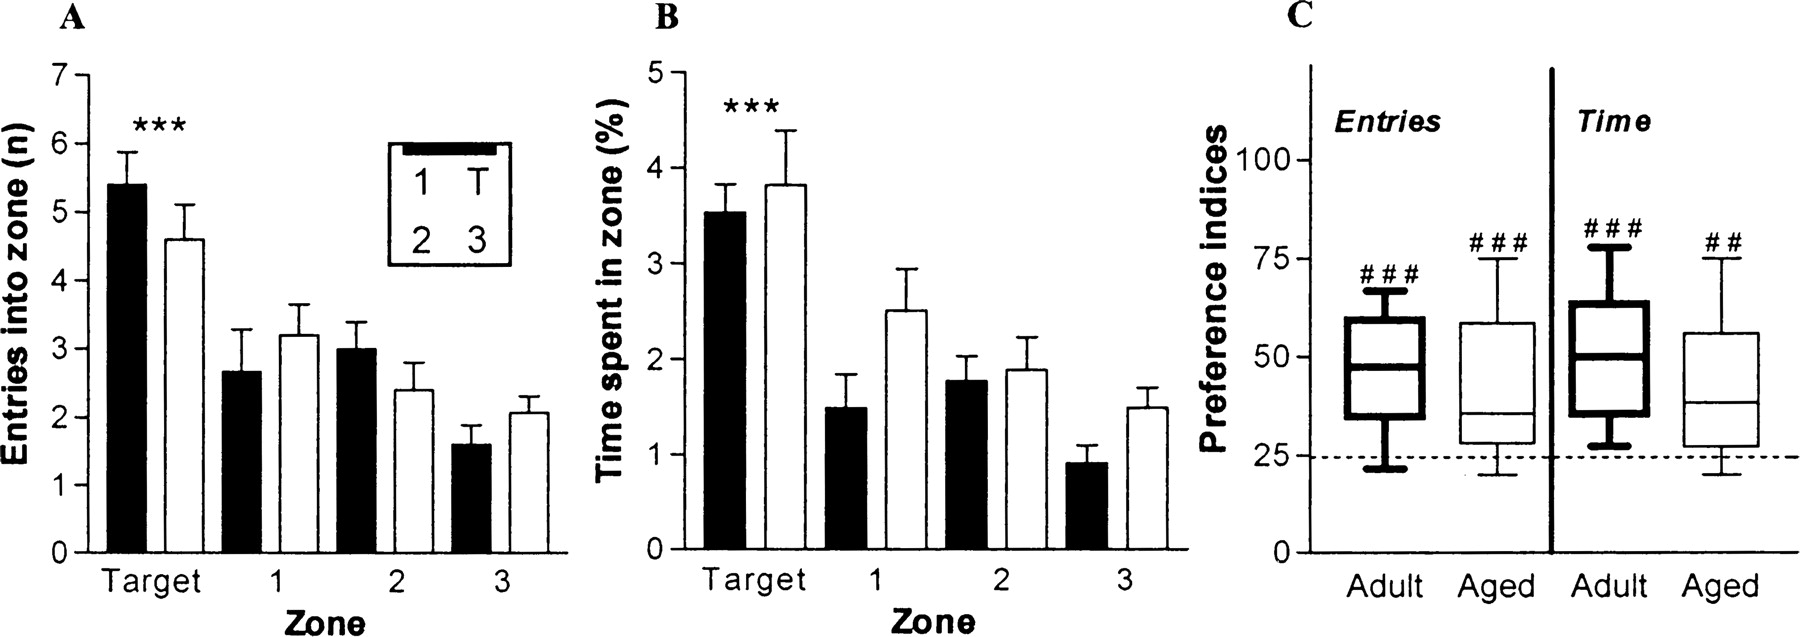
Adult (solid bars in A,B; thick box plots in C) and aged (open bars in A,B; thin box plots in C) mice could orientate themselves and found the platform when only the featural information was available. (A, inset) A scheme of the maze. (Thick bar) Landmark position, (T) target zone, (1, 2, 3) other (incorrect) zones. Number of entries into and time spent in zones are represented by means plus S.E.M. The preference indices are shown in standard box plots. ***P < 0.001, difference between the target zone and the other zones within both groups (Newman-Keuls post hoc after a significant effect on zones); ##P < 0.01, ###P < 0.001, as compared with chance level (25%) (Wilcoxon signed-rank test).



