


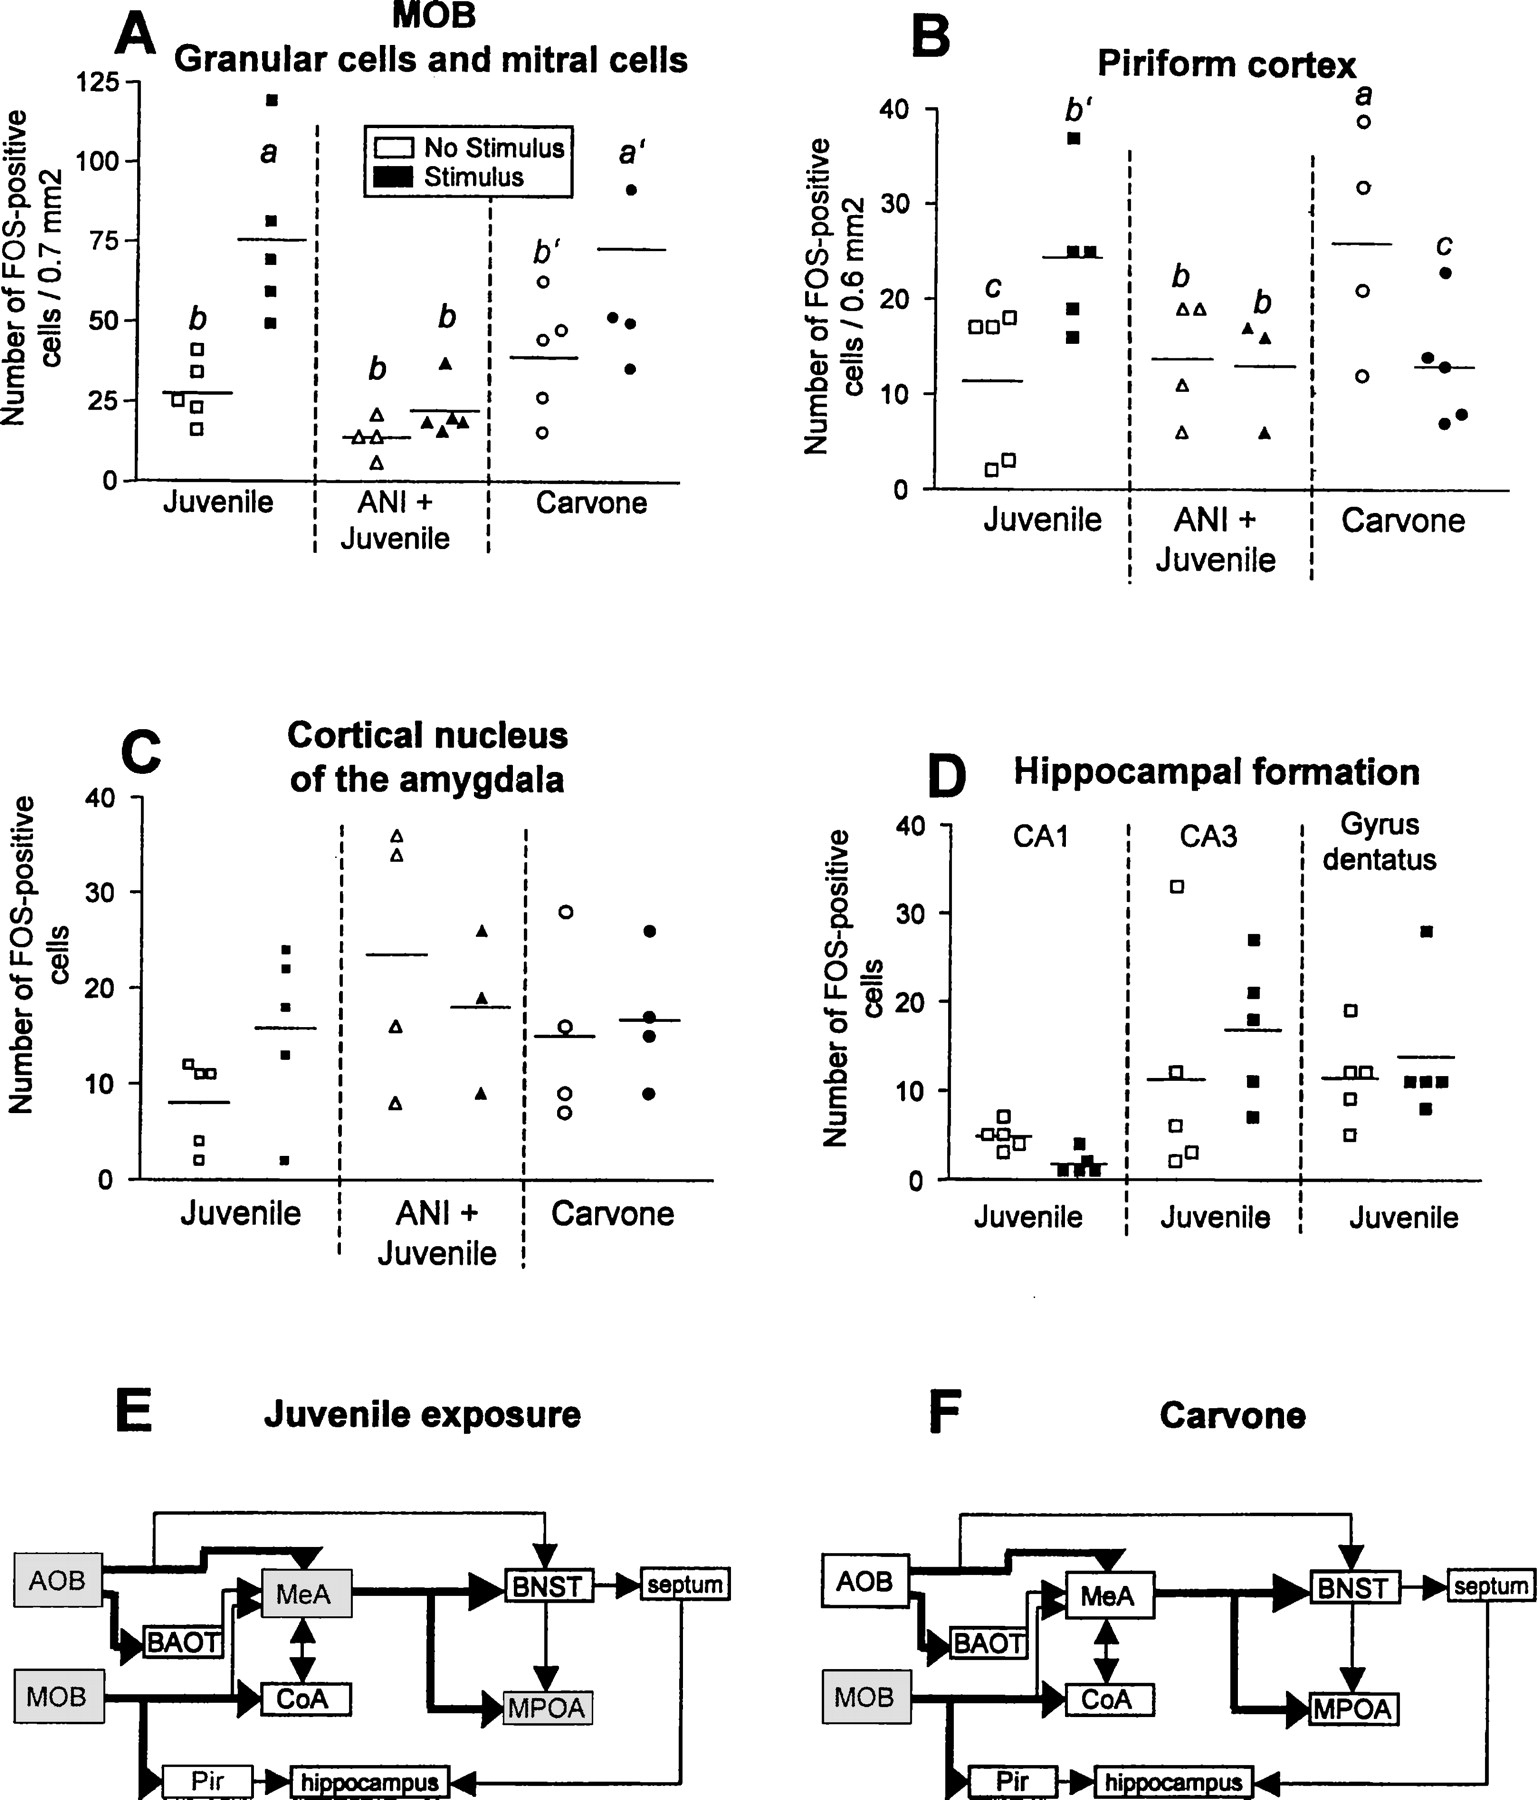
Figure 6.
(A–D) Number of Fos-immunoreactive cells measured in selected brain areas of the main olfactory system in adult male mice. For more details, see Figure 5 legend. a, P < 0.05 vs. b and c; a′, P < 0.05 vs. b; b′, P < 0.05 vs. c, ANOVA followed by Fisher's-LSD test. MOB, main olfactory bulb. (E,F) Activated brain areas (gray) as measured by increase in Fos-immunoreactive cells in response to (E) sampling-like juvenile exposure and (F) carvone exposure. Abbreviations of brain areas as in Figure 1.



