


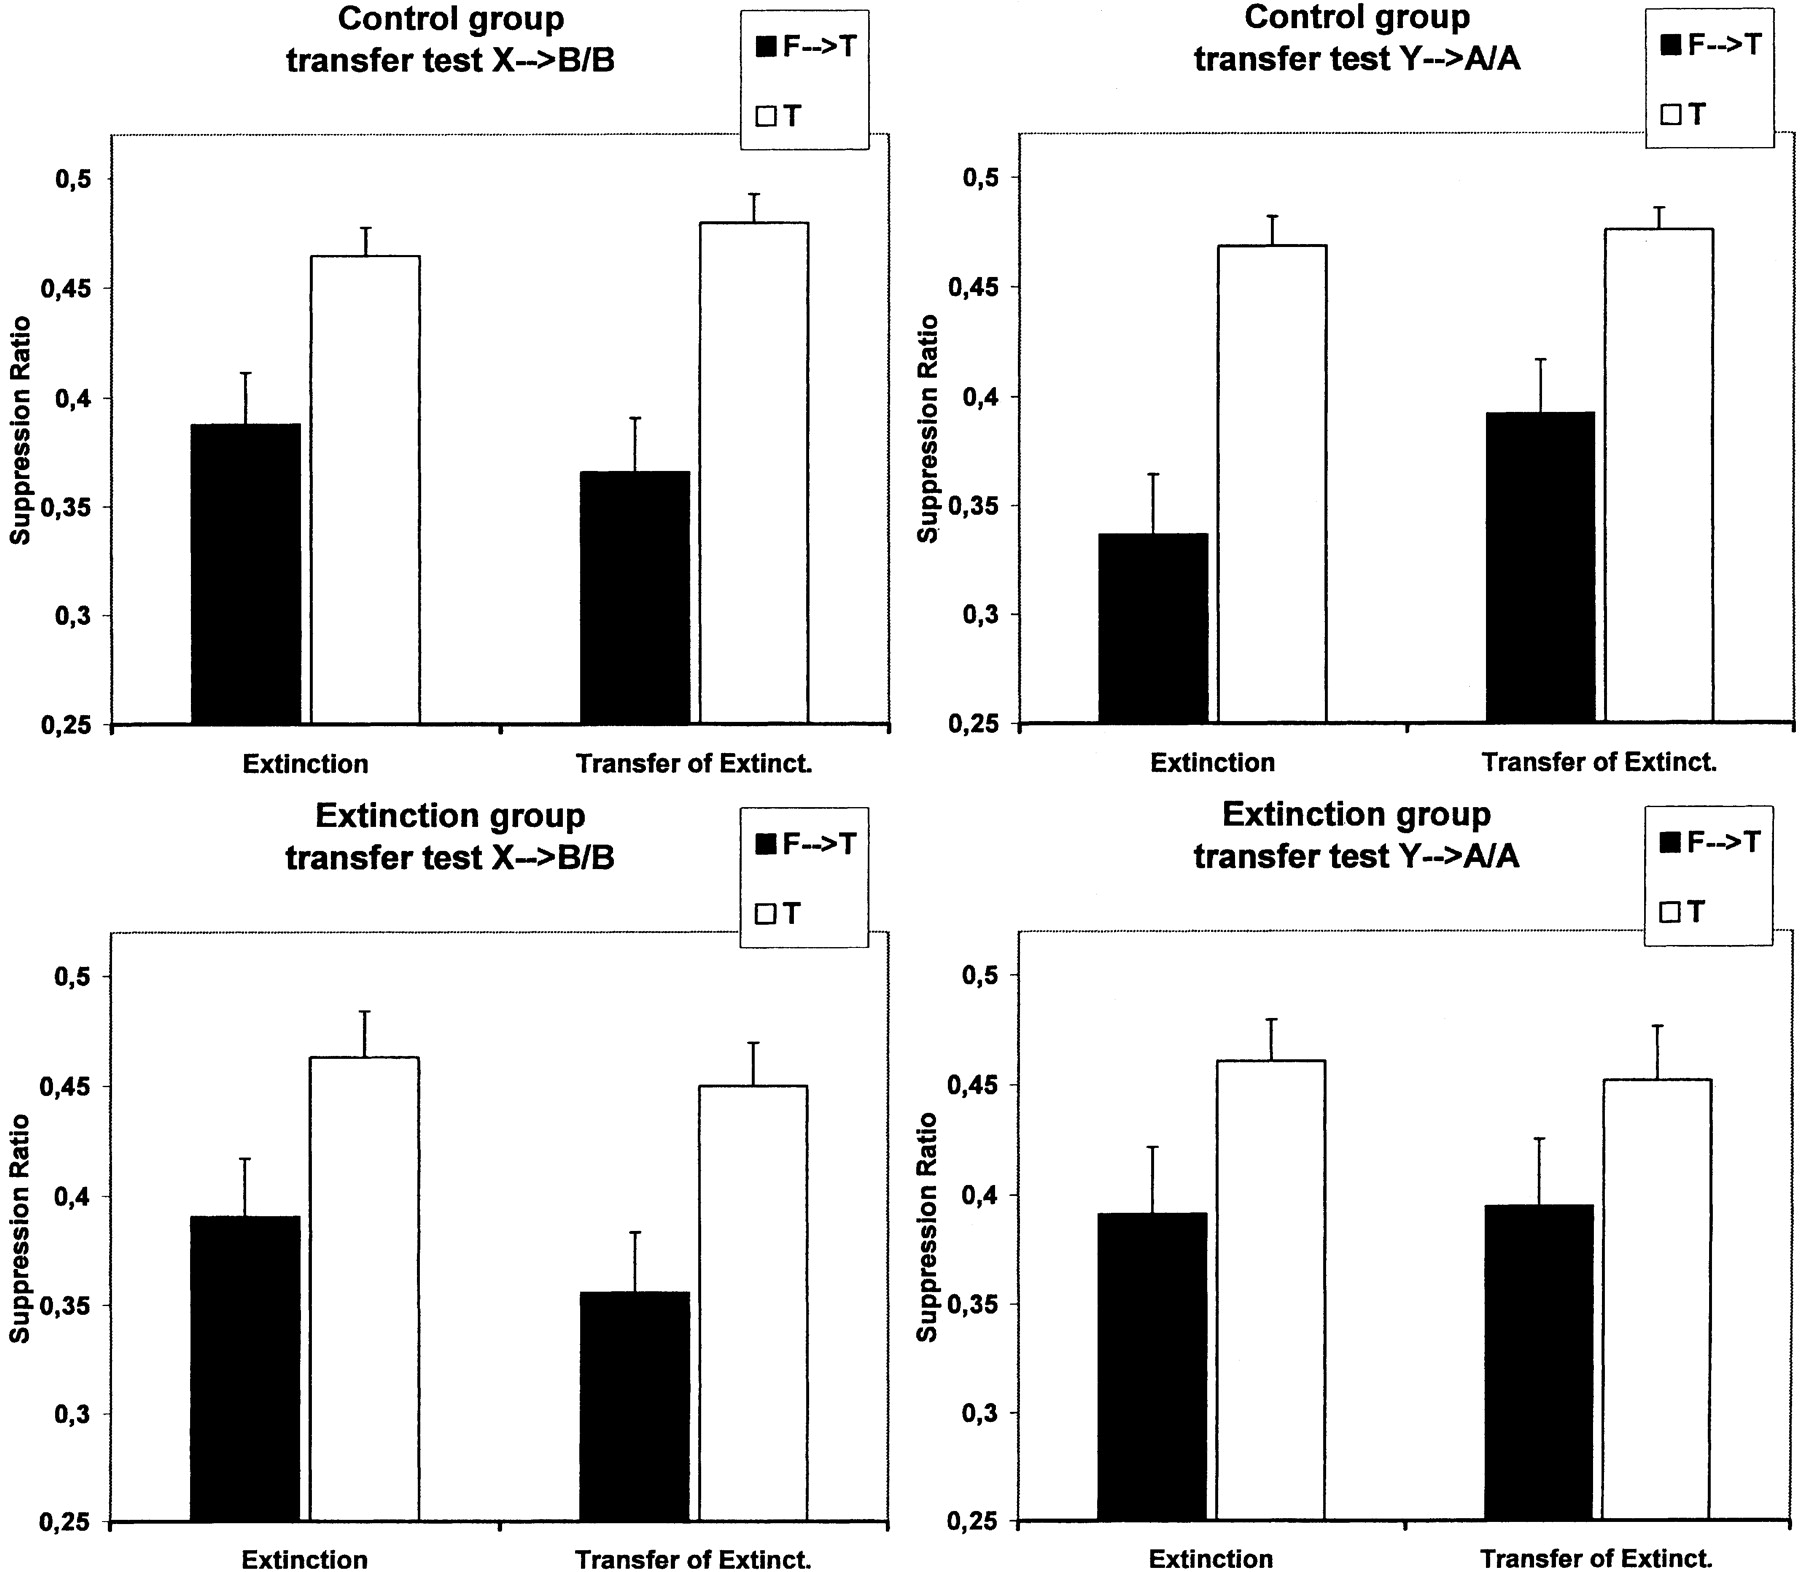
Figure 5.
(Experiment 2) Mean suppression ratios at the tests of Extinction and Transfer of Extinction for the targets alone (T) and for the targets preceded by the feature (F→T), separately for the X→B/B (left side) and for the Y→A/A (right side) discriminations; the top half of the figure depicts the results of the Control group, the bottom half the results of the Extinction group. Lower values represent stronger conditioned responding. Brackets represent standard errors of the means.



